
Bitcoin (BTC) traded slightly under $115,000 on Monday, struggling to clear resistance near $116,000 after logging a near-4% gain last week.
The move reflects ongoing uncertainty in the market despite strong institutional demand and heavy inflows into spot Bitcoin exchange-traded funds (ETFs).
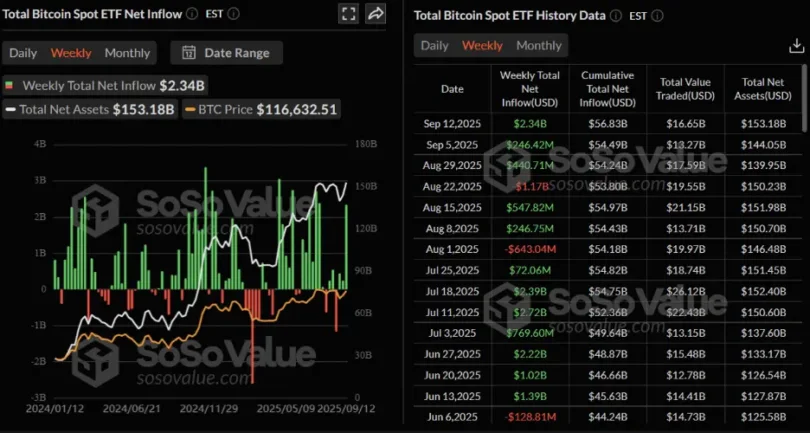
Data from SoSoValue showed that U.S. spot Bitcoin ETFs brought in $2.34 billion in net inflows over the past week, the highest since mid-July.
At the same time, corporations including Capital B and Prenetics disclosed fresh BTC purchases, signaling resilience in the market even as prices hit near-term hurdles.
Bitcoin ETFs Record $2.34B in Weekly Inflows
It is still being propelled by institutional appetite. Spot Bitcoin ETFs have already recorded three weeks of consecutive positive flows, and the last week of $2.34 billion was the highest recorded since mid-July. Analysts believe the trend will keep on rising the Bitcoin to give it the boost to further its rally.
Demand was also supported through corporate adoption. Monday Capital B announced that it had purchased an additional 48 BTC to its treasury, totaling 2,249 BTC. A medical firm, Prenetics, purchased 40.6 BTC and planned to purchase 1 BTC every day. According to BitcoinTreasuries.NET, its total reserves are currently 228 BTC.
Even mid-sized investors are also contributing. According to CryptoQuant data, wallets with 100 to 1,000 BTC, which were described as Shark wallets, have added approximately 1 million BTC ever since July 2024.
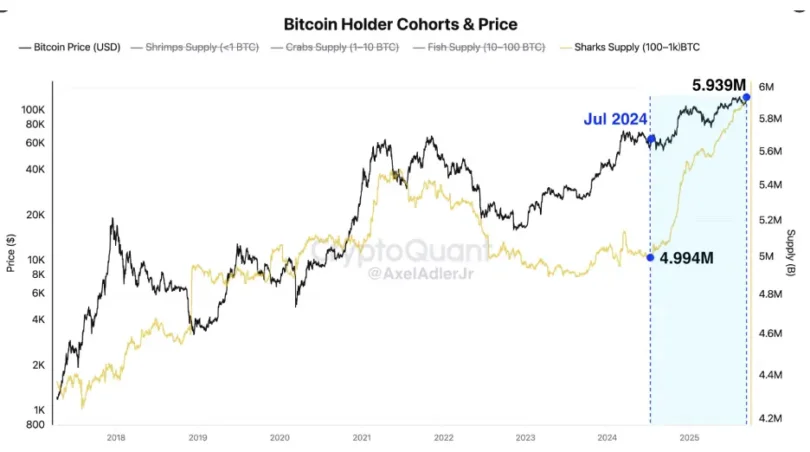
Their cumulative balance is now close to 5.9 million BTC, indicating a confident trend among this community.
There were indications of the tightening of supply over the weekend. The Scarcity Index of CryptoQuant registered a positive spike on Binance on Sunday that had not been registered in June.
The reading reveals that there were either huge withdrawals in the exchange or low sell orders. Historically, such actions have been precursors of rallies, such as the June soaring of Bitcoin to $120,000.
Price Stalls at $116K Resistance
Following these inflows, Bitcoin has stalled at the resistance level of $116,000. The asset has increased 3.72 percent in the previous week and has been dragging back after facing the barrier on Saturday. As of Monday, BTC is stuck under the level.
| Day | Minimum Price | Average Price | Maximum Price |
|---|
A daily close above $116,000 is seen as key for further upside. Analysts note that clearing this hurdle could open the path toward the $120,000 psychological mark.
Technical indicators present a mixed picture. The daily Relative Strength Index (RSI) reads 54, showing bullish momentum but pointing lower toward neutral territory. The Moving Average Convergence Divergence (MACD), which turned bullish on September 6, continues to show upside momentum.
On the downside, if Bitcoin fails to break $116,000, a correction could follow. In that case, the next support lies near the 50-day Exponential Moving Average (EMA) at $113,393.
Ethereum Foundation Unveils Privacy Roadmap with Rebranded Initiative
The Ethernet foundation has made a major step into supporting user privacy within its network by launching a new roadmap to integrate privacy within its ecosystem.
The company has renamed its privacy and scaling explorations (PSE) program as the privacy stewards of Ethereum. It was announced on September 12 that the rebranding is accompanied by a detailed plan according to which privacy will become a key characteristic of the Ethereum long-term infrastructure.
The foundation says that the roadmap is indicative of its overarching vision of protecting Ethereum users against surveillance and guaranteeing that the network is a fundamental backbone of the digital ecosystem of commerce, identity, and financial systems in the world.
The transition also indicates a change from purely academic research towards more practical and problem-oriented privacy solutions.
The plan highlights the application of Ethereum as an upscale platform of governance, the internet of value, and digital identity. Nevertheless, foundation leaders emphasized that this vision is unattainable without all-embracing privacy protection.
There are three key areas of development that are indicated in the roadmap. The vision of the project is to ensure that private transactions are as simple and cheap as public transactions, which is why they are working on PlasmaFold, a layer-2 privacy system to transfer money, on confidential DeFi and private voting products.
The problem of information leakage when using blockchain queries is dealt with in Private Reads, which offers privacy-saving alternatives of remote procedure call (RPCs), where sensitive data, including IP addresses and wallet activity, is kept secret during network interactions.
In the meantime, Private Proving is dedicated to enhancing zero-knowledge proofs (ZKPs) with the help of cost reduction and simplification of proof creation. This would enable the versatile and secure proofs to execute on ordinary machines, assisting in the facilitation of easier data portability and legitimacy checking.
The foundation provided that PSE will implement many high-priority projects within the next few months and years, such as institutional adoption features.
Building on Buterin’s Privacy Advocacy
Ethereum’s privacy vision has long been supported by co-founder Vitalik Buterin. In April 2025, he presented a simplified Layer-1 privacy roadmap featuring upgrades such as FOCIL and EIP-7701. These proposals were designed to improve the usability of privacy protocols like Tornado Cash and Railgun by removing reliance on centralized relayers.
With PSE now steering privacy-focused development, the foundation believes these efforts will play a decisive role in boosting Ethereum’s adoption and sustaining its global relevance.
ETH Price Action Amid Developments
Ethereum native token (ETH) is also performing well in the charts, even though it has been experiencing volatility in the recent past, along with the roadmap announcement. By Monday, the ETH is trading closest to 4,522, which is a 2.3% drop.
Nonetheless, the token has been trading at elevated levels of approximately 5 percent over the last seven days, implying that the pullback is a subset of a larger uptrend.
The price action depicts great resistance near the $5,000 mark, where the momentum has faded away. The MACD indicator is still in the bullish region, but the histogram is weakening with the MACD line approaching the signal line, which is an indication of a slow pace of upward movement and the probability of bearish crossover in case of an increase in the selling pressure.
The Relative Strength Index (RSI) is at 55, which is a neutral position. According to analysts, ETH can move either upward or downward, while the following sessions will decide whether the asset will carry on with its positive trend or further decline.
The volume of trading is marginally lower than in recent highs, which supports the perception that the existing downturn might be more of a cooldown than a reversal of trends. To be positive, bulls will need to increase buy-side action to shoot ETH past its next key resistance tier.
Polkadot Faces Pullback but Holds Medium-Term Bullish Setup
Polkadot (DOT) pulled back from last week’s highs, trading at $4.20 on Monday as broader market sentiment weakened. The decline coincided with investor caution ahead of the U.S. Federal Reserve’s decision on interest rates, expected on Wednesday.
Despite the short-term retreat, Polkadot continues to show signs of medium-term strength, supported by a newly approved resolution that imposes a cap on token supply and an ascending triangle structure on the daily chart.
The Polkadot community recently voted in favor of Resolution 1710, with 81% of participants supporting a hard cap of 2.1 billion tokens for the protocol’s maximum supply.
This marks a shift from the previous unlimited supply model and introduces reduced annual emissions. The change is seen as reinforcing long-term scarcity and predictability for DOT.
Under the old model, Polkadot’s supply was inflationary, averaging around 1.522 billion DOT at present.
The new model projects a total supply of approximately 1.91 billion tokens, compared to 3.4 billion that would have been reached without the cap. Token issuance will now occur every two years on March 14, aligning with Pi Day.
Market demand has remained notable, reflected in futures Open Interest (OI), which was about $594 million on Monday after peaking at $634 million on Sunday.
The pullback in OI accompanied DOT’s drop from $4.62 to $4.20, suggesting short-term profit-taking. However, analysts note that Polkadot retains its bullish setup once consolidation stabilizes.
Technical Picture: Support Levels in Focus
DOT trades below the 200-day Exponential Moving Average (EMA) at $4.26 after slipping from last week’s high of $4.62. Momentum indicators show a mixed picture, with the Relative Strength Index (RSI) dropping to 54.
A further decline below the midline could open downside pressure toward the $4.00 support, where both the 50-day and 100-day EMAs converge.
On the bullish side, a reversal in RSI momentum could validate the ascending triangle pattern forming on the daily chart. This pattern points to a potential breakout target near $6.34, representing an estimated 35% move from current levels.
Traders are closely watching the resistance level at $4.67. A confirmed breakout above this barrier would validate the triangle’s bullish projection.
Another supportive development would be the 50-day EMA crossing above the 100-day EMA to form a Golden Cross a technical signal often associated with sustained uptrends.
Overall, while short-term conditions remain uncertain, Polkadot maintains a bullish framework that could drive gains once broader market sentiment steadies.


