
Bitcoin is trading near $112,961 after a rough week across risk assets. Daily volume sits around $51.2 billion. Market value is still above $2.25 trillion. The dip hurt sentiment, but some large buyers treated it as an entry point.
MicroStrategy bought another $99.7 million in bitcoin. The company keeps adding to its reserve despite noise about S&P 500 exclusion and dilution.
Metaplanet in Japan went bigger, purchasing $632 million. That lifts its stack to 25,555 BTC, worth roughly $3 billion.
Strive made the boldest move. After merging with Semler Scientific, it allocated $675 million to bitcoin. The combined company will hold more than 10,900 BTC, valued at over $1.2 billion.
Strive paid a 210% premium for Semler, gaining a profitable diagnostics business, but its focus is building a sizable crypto treasury.
These buys show steady institutional interest. Instead of stepping back during volatility, some of the largest corporate holders are increasing exposure. That adds a degree of support under the market.
The timing matters. Regulators appear more open to digital-asset exposure. Demand on Wall Street for crypto-linked products is strong. Treasuries may be positioning ahead of possible ETF approvals. Their bids can improve sentiment and help absorb selling pressure.
If more firms follow MicroStrategy and Metaplanet, demand could outpace new supply. Bitcoin’s cap is 21 million coins. In that setup, the current range near $113,000 looks like an accumulation zone rather than a top.
| Day | Minimum Price | Average Price | Maximum Price |
|---|
Bitcoin Technical Outlook: Key Levels in Focus
Bitcoin is trading on charts directly below the 200-day EMA of $113,450, which bulls must recapture to alleviate the strain of the selling side. The next target is the 50-EMA at $115,500, and other resistances are at 116,150 and 118,000.
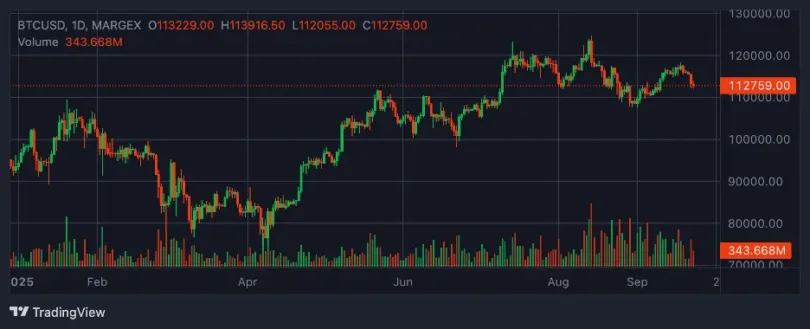
The long lower wicks around the area of $112,500 are an indication that buyers are entering the market, yet the momentum is still in the hands of sellers until a clear turning point candle is achieved.
The Relative Strength Index (RSI) is at 36, which is an indication of oversold, but the traders are waiting to be convinced before they can call out a rebound.
Support levels can be found at 110,850 and 108,750 in case Bitcoin falls below 113,000. On the positive side, a breakout above $114,750 would establish a course to hit to $120,000.
Careful traders can wait, whereas aggressive shorts can take up to $110,800. Bullish patterns might have to be validated through a hammer or engulfing pattern around support.
There is still a structure of higher lows in longer-term charts because of summer, implying that the present weakness can be formed into an accumulation phase before the next leg higher.
Market mood has changed to one of uncertainty rather than confidence as volatility is accelerating and momentum decelerating. The pullback of Bitcoin has reached the bigger crypto market, with the altcoins recording steep losses as well.
The consolidation and retracement have put traders at cross crossroads as to whether the downfall is a short-term adjustment or the onset of a further decline.
Short-Term Holders Absorb Heavy Losses
With the turbulence on the market, onchain analyst Darkfost identified one crucial indicator, which was that short-term holders (STHs) were facing another tough day.
Statistics indicate that these more recent investors made a loss of approximately 30,000 BTC on one day.
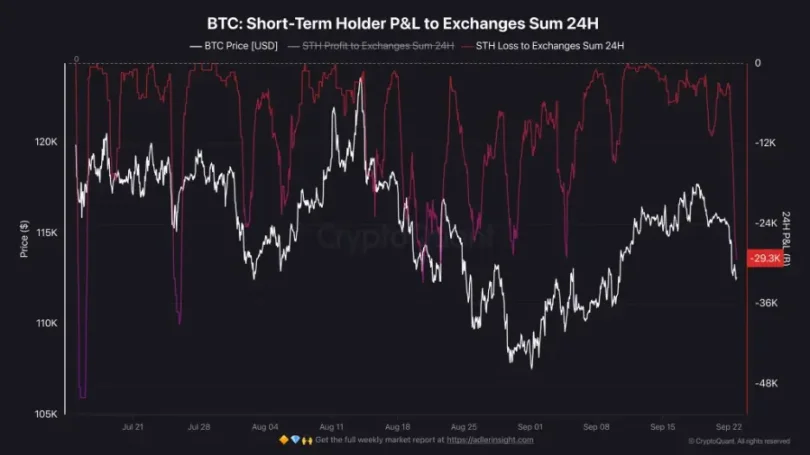
In the case of many who joined the market in the recent past, all the gains that they had not realized have already gone, and they are now making losses.
Darkfost’s assessment emphasizes the strain on this group. With Bitcoin hovering near $111,400, most of their prior gains have been erased, pushing them into negative territory.
The 30,000 BTC loss recorded in one day highlights the sharp impact of the downturn. While painful, Darkfost suggests this process may ultimately prove healthy for market structure.
He explained that STH capitulation often works as a reset mechanism. As leveraged positions are cleared and weaker hands exit, selling pressure is absorbed, reducing supply overhang.
Though disruptive in the short term, these resets can form a base for stronger rallies once conditions stabilize. Historical cycles, he noted, have shown similar phases where losses preceded longer periods of growth.
Broader financial markets are also weighing on sentiment as tighter liquidity and slowing global growth continue to dominate the macro environment. Even so, analysts remain constructive on Bitcoin’s long-term outlook.
They point to the steady advance of institutional adoption and gradual regulatory clarity as reasons for resilience.
In this view, the current wave of volatility may represent a transitional phase, preparing the ground for a healthier and more durable market framework in the months ahead.
Dogecoin Faces Pressure as Risk-Off Sentiment Weighs on Market
Dogecoin (DOGE) struggled to hold support near $0.2400 on Tuesday, with risk-off sentiment continuing to shape the broader cryptocurrency market.
The meme coin has dropped 21% from last week’s peak of $0.3072, raising concerns that weakness could deepen if negative sentiment persists throughout the week.
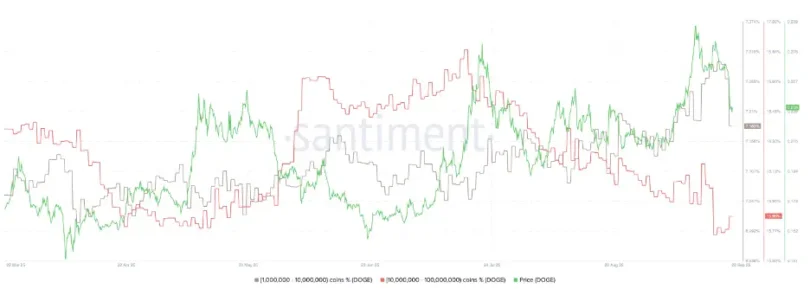
On-chain data from Santiment shows that large Dogecoin holders have been steadily cutting exposure in recent months. Wallets containing between 10 million and 100 million DOGE now account for 15.86% of the total supply, down from 16.85% in July.
In contrast, mid-sized holders with balances between 1 million and 10 million DOGE had increased their positions through July and August.
Their share of supply peaked at 7.3% on September 8 before slipping to 7.18% in recent days, reflecting renewed caution among investors.
Analysts say that if whales continue to offload holdings, a meaningful recovery in Dogecoin’s price may be unlikely. The Santiment Supply Distribution metric is being closely tracked to determine whether demand could support a rebound toward the recent $0.3072 high.
Additional on-chain indicators reinforce the weak outlook. The number of active addresses has averaged just 55,000 as of September 22, a sharp drop from the 517,000 daily active addresses recorded in June.
The June surge in activity coincided with a rally in DOGE that pushed the token as high as $0.2873 in July.
The current decline in network activity suggests a slowdown in adoption and demand for Dogecoin. Unless this trend reverses, analysts warn that bulls may find it difficult to build sustainable momentum, leaving the token vulnerable to continued selling pressure.
Dogecoin is trading slightly above its 50-day Exponential Moving Average (EMA), which currently offers short-term support at $0.2387.
Technical signals indicate that the meme coin’s near-term direction remains tilted to the downside.
The Moving Average Convergence Divergence (MACD) continues to flash a bearish signal, one that has persisted since Monday. As long as the blue MACD line stays below the red signal line, the indicator suggests further weakness, with many investors expected to trim their holdings.
Momentum also shows signs of deterioration. The Relative Strength Index (RSI) sits at 45 and is trending lower, signaling that selling pressure is outweighing demand. A slide toward oversold levels would mark an even sharper drop in buying activity.
Can DOGE Rebound From the 0.618 Fibonacci Retracement Zone?
Traders are watching several key thresholds. Immediate support comes from the 50-day EMA at $0.2387. Below that, the 100-day EMA at $0.2259 and the 200-day EMA at $0.2192 stand as secondary levels if declines deepen.
Still, the possibility of a rebound remains. A daily close above the 50-day EMA could attract dip-buying interest, potentially opening the door for a recovery toward last week’s high of $0.3072 should bullish momentum return.
Dogecoin is showing signs of setting up for a major bullish move, according to a chart analysis shared by crypto analyst Ali Martinez.
The 12-hour chart of DOGE/USDT highlights a strong ascending trendline that has consistently supported the meme coin since mid-June.
At the time of posting, Dogecoin trades at $0.2412, holding above a key Fibonacci retracement level that reinforces this zone as a potential accumulation area.
The chart shows DOGE bouncing near the 0.618 Fibonacci retracement level at $0.2289 after a steep pullback from recent highs of around $0.3067.
This retracement aligns closely with the long-standing ascending support trendline, which has acted as a launchpad for previous rallies. The ability of DOGE to maintain this structure suggests bulls are still in control, despite recent market weakness.
Martinez’s projection outlines a possible consolidation phase between $0.26 and $0.30 in the coming weeks. This range-bound action, marked by several retests of the ascending trendline, is illustrated in the chart through dotted price projections.
A breakout above the $0.3067 resistance level, which coincides with the 1.0 Fibonacci extension, is viewed as the gateway to higher targets.
If Dogecoin clears $0.31, the chart points toward sequential Fibonacci extensions at $0.3778 (1.272), $0.4213 (1.414), and ultimately $0.4926 (1.618). These levels provide a technical roadmap for traders eyeing medium-term upside.
A sustained rally toward $0.50 would represent more than a 100% gain from current prices, echoing Martinez’s view that this area offers an attractive entry point.
On the downside, losing the $0.2289 support could expose DOGE to further declines, with secondary support at $0.2091 (0.5 Fibonacci). However, as long as the ascending trendline holds, the broader structure remains bullish.
With consolidation likely before a breakout, Dogecoin appears to be in a pivotal accumulation zone. Traders will closely watch the $0.30–$0.31 barrier in the weeks ahead, as a decisive move above it could confirm a breakout rally toward $0.50.
What Does the Surge in On-Chain Perpetual Trading Volume Mean for Traders?
Once the market leader in the on-chain perpetuals segment, Hyperliquid is quickly being overtaken by emerging market leaders Lighter and Aster.
In May, Hyperliquid controlled 71% of the industry. That number has since dropped to 38% based on pseudonymous Dune Analytics author @uwusanauwu’s statistics.
Comparatively, Lighter, which has 16z as its venture capital provider, and Aster, which is Binance Labs-backed, have risen to 16.8 percent and 14.9 percent of the market, respectively, since May, when they were holding single-digit shares.
The figures are pegged on the weekly trading volumes and do not include any wash trading.
Decentralized on-chain perpetuals market. On-chain perpetuals are a form of derivatives, perpetual futures contracts, which are over-the-counter contracts with no expiration date and run directly on blockchain networks.
These contracts are based on a funding rate mechanism to ensure that prices are maintained in accordance with the spot markets, and this enables the traders to speculate on the movements of assets without restrictions on time.
The activity on any platform has increased in recent months. The cumulative trading volume in the combined market has seen almost seven hundred and sixty billion dollars within the last four weeks, and 42 billion of the same changed hands in the last 24 hours alone.
There is also an increased number of active protocols, which, in 2022, were limited to two protocols, but now, more than 80 protocols are active.
The entry of new rivals emphasizes the permeable nature of the market, with the traditional barriers to market entry removed, it is now possible to have any team with the technical competence to start up a competing platform.
The rivalry between Aster and Hyperliquid has intensified to a straightforward competition. Hyperliquid has launched perpetual contracts on the native token of Aster, ASTR, which had 3x leverage last week.
On Monday, in its turn, Aster gave Hyperliquid HYPE token perpetuals with leverage of up to 300x, which highlights the escalating market share war.


