
- Cryptocurrency trading, forex, stocks, indices, futures, and others use technical analysis for profitable setups and price direction predictions.
- Tools in technical analysis include Relative Strength Index (RSI), volume, chart patterns, trendlines, and triple moving average crossover.
- Triple moving average crossover offers traders ideas for optimal entry or exit positions regarding crypto assets.
- This guide focuses on learning to trade using triple moving average crossover.
- Utilize this strategy for support, resistance, entries, and exit positions for crypto assets.
- Predict market direction with high probability using this method.
- Spot great trading opportunities with this simple but powerful technique.
Reasons To Use Triple Moving Average Crossover
Moving averages are charting tools commonly used by many traders in their technical analysis; this is a technical tool that produces a high-profit return with great price pattern movement.
The technical analyst is more profitable trading in the direction of the market. Moving averages help traders to detect a change or potential change in the momentum and direction of crypto assets. When respected by crypto assets, triple moving averages can act as support and resistance. When these regions are broken signifies a broken market structure, and a potential change could be underway.
Most financial traders use moving averages to ensure the market trend is in their favor. The triple moving average crossover strategy is very effective and advantageous to traders who want to successfully trade the financial market. Here are some benefits of learning how to use triple moving average crossover.
- The triple moving average crossover provides traders with a clear picture of where the market is headed.
- Triple moving average crossover assists traders in making better use of support and resistance, particularly during bullish trends.
- When the triple moving average crossover occurs, traders can enter a trade or exit the market as soon as the trend direction turns against them.
- Traders can use the triple moving average crossover to set their stop loss accordingly.

What Is A Moving Average
Moving average (MA) is technical indicator traders and investors use to smooth out price data by creating an average price closed over a period. The price risk and volatility over a specific period are reduced to the minimum.
This is a commonly used tool by traders to determine long-term trends in the market and as an efficient indicator for entry and exit of trades, and to filter noise prices in the financial markets. For example, a five-day moving average is the average total closing prices over five days.
The most commonly used moving averages include simple moving averages and exponential moving averages.
Simple Moving Average (SMA)
This is the most straightforward moving average, where the averages are calculated for a period’s closing prices over a while. For example, assuming a trader picks a timeframe of 1H, the simple moving average would refer to the average prices over five hours.
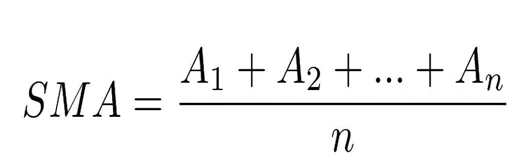
A = Sum of all closed prices over a period of the moving average periods.
n = Number of closed prices
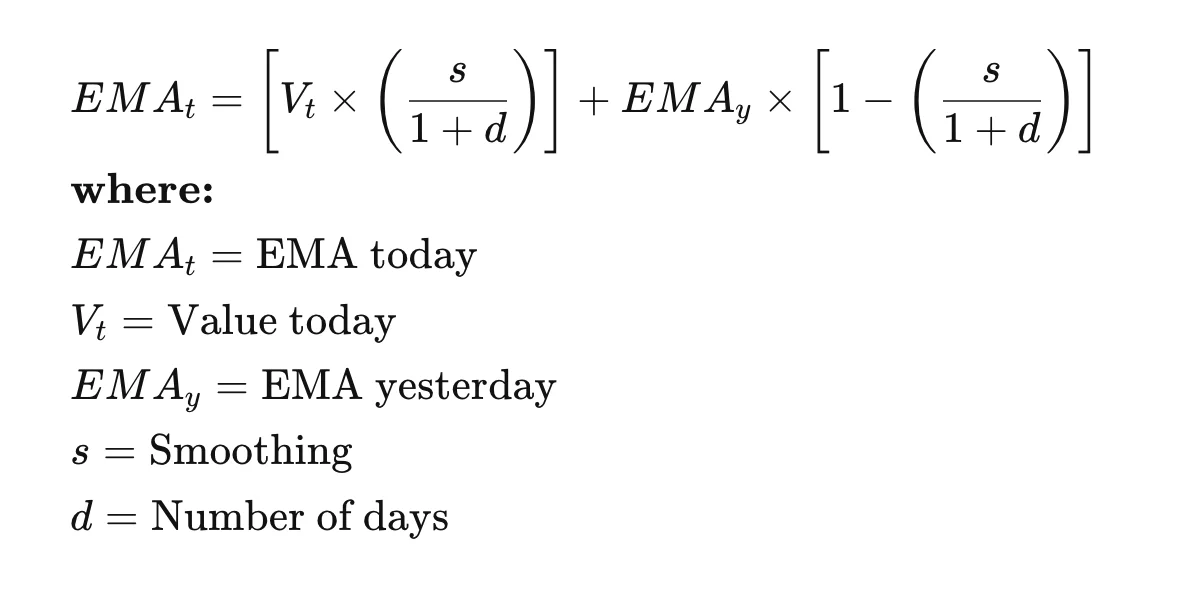
Exponential Moving Average (EMA)
An exponential moving average, also known as the weighted moving average, is a tool or indicator used by traders to emphasize the current data point and analyze trend direction. The exponential moving average is more effective because it reacts to price change and direction faster than the simple moving average.
What Is Moving Average Crossover?
A moving average crossover refers to an area on the chart where the short-term or fast-moving average crosses above or below the long-term or slow-moving average. This crossover helps investors and traders to find patterns, trend formation, direction at which the trend is headed, potential exit and entry points, and potential trend reversal.
Although this tool looks simple, it has created a lot of names around it, like a golden cross and a death cross. The golden cross happens when the shorter-term moving average crosses the longer-term moving average from below to above. In contrast, the death cross happens when the shorter-term crosses the longer-term moving average from above to below. The market usually moves in trends; traders need more sensitive moving averages to help spot the change in trend direction within a short time.
What Is A Triple Moving Average Crossover?
The triple moving average crossover is a technical analysis used to find profitable outcomes for trades. This occurs when three moving averages of different lengths cross over each other to the upside or downside of a trend.
Investors and traders always look for the best profitable strategy with maximum gains. They explore different strategies from chart patterns to indicators with moving averages not exempted. Triple moving average crossover is a highly profitable technical analysis tool employed to maximize uptrends and minimize downtrends or downsides in trading.
Is A Moving Average Crossover A Good Indicator?
Moving average crossover helps filter price fluctuations due to how volatile the crypto market can be, especially when using three exponential moving averages. This help to provide a better picture of trends, when a trend starts, if the trend is intact or broken, and the market’s next direction.
If prices close above the moving averages, this implies the start of a bullish trend, and if prices close below the moving averages, this could signal the start of a downtrend. Relying on only moving averages as traders or investors is incorrect, as it can be flawed, it is best to combine moving averages with other indicators or strategies for high and better trade probabilities.
To improve the accuracy of moving averages, traders and investors use triple moving average crossover for better confirmation and to filter the price volatility of the market.

What Does A Triple Moving Average Crossover Tell You?
One of the most common technical analysis tools used to know the direction of trends is the 3 moving average crossover. When it proves successful, it would be able to know price direction, entries, and exits and be alert as price invalidates the trend. Besides the fact that traders use triple moving averages to know price direction, they use them to identify support and resistance areas.
The triple moving average is made up of three separate moving averages with different lengths to improve accuracy and probable outcomes.
The 50-day moving average, 100-day moving average, and 200-day moving average are used to establish market trends accurately.
How Do You Trade A Triple Moving Average Crossover on Margex?
Margex is a Bitcoin-based derivatives platform that allows crypto traders to trade up to 100x leverage with various crypto assets.
The Margex platform is designed so that the UI makes trading easy even for beginners, and some of the features are tailored to help traders become more profitable.
- There are no hidden commissions.
- You can make a deposit of as little as $10 and trade with a $1 leverage limit!
- The user interface has been designed to facilitate quick deposit and withdrawal.
- As traders you may sometimes want to make changes to leverage for your open position, you can adjust or change your leverage.
- BTC, USDT erc20, USDT trc20, ETH, USDC, DAI, USDP, Tron, and WBTC are examples of collateral deposits. This also allows you to trade any trading pair with any collateral without having to swap coins.
- Margex platform makes it possible for traders to use technical analysis tools and charts are available for real-time trading all for free.
- You can also earn more with Margex referral program with up to a 40% flat commission rate!
To gain access to the Margex platform and begin trading, you must first create new user accounts and verify your email address in order to gain access to the Margex UI page, where you can trade, while existing users can do so by logging in. You can access Margex to trade with advanced tools like the 3 moving average crossover. here.

Assuming you have login details to the Margex platform, you will have access to their technical analysis tools, which are built with real-time prices to help you make money trading.
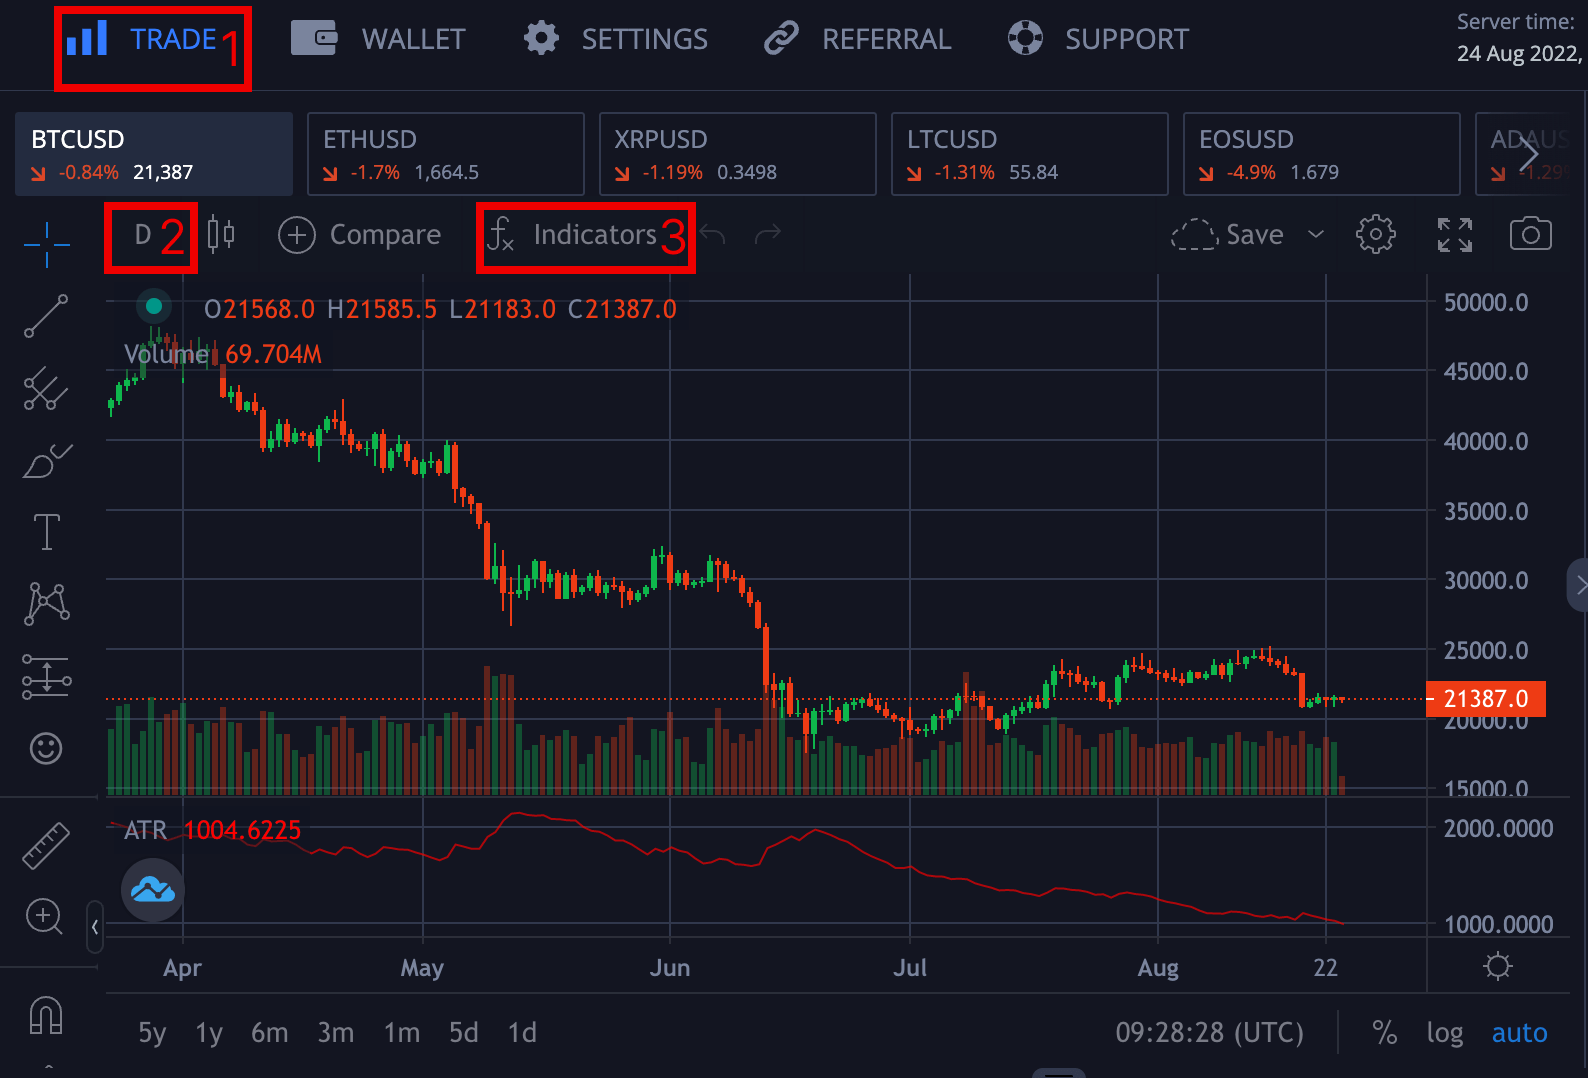
- Trade – Click on trade at the top labeled 1 to access technical analysis tools where you can seamlessly execute your trades.
- Timeframe – Click on the part labeled 2 to set the timeframe you want to trade based on your personality. You can choose between timeframes ranging from one minute to one month.
- Indicators – Clicking on Indicators, traders can access all free indicators available on Margex to trade based on your strategies. This article focuses more on setting up the Exponential Moving Average and how to trade profitably with it. You can access all available indicators by clicking on the Indicator icon, then searching for moving average exponential.
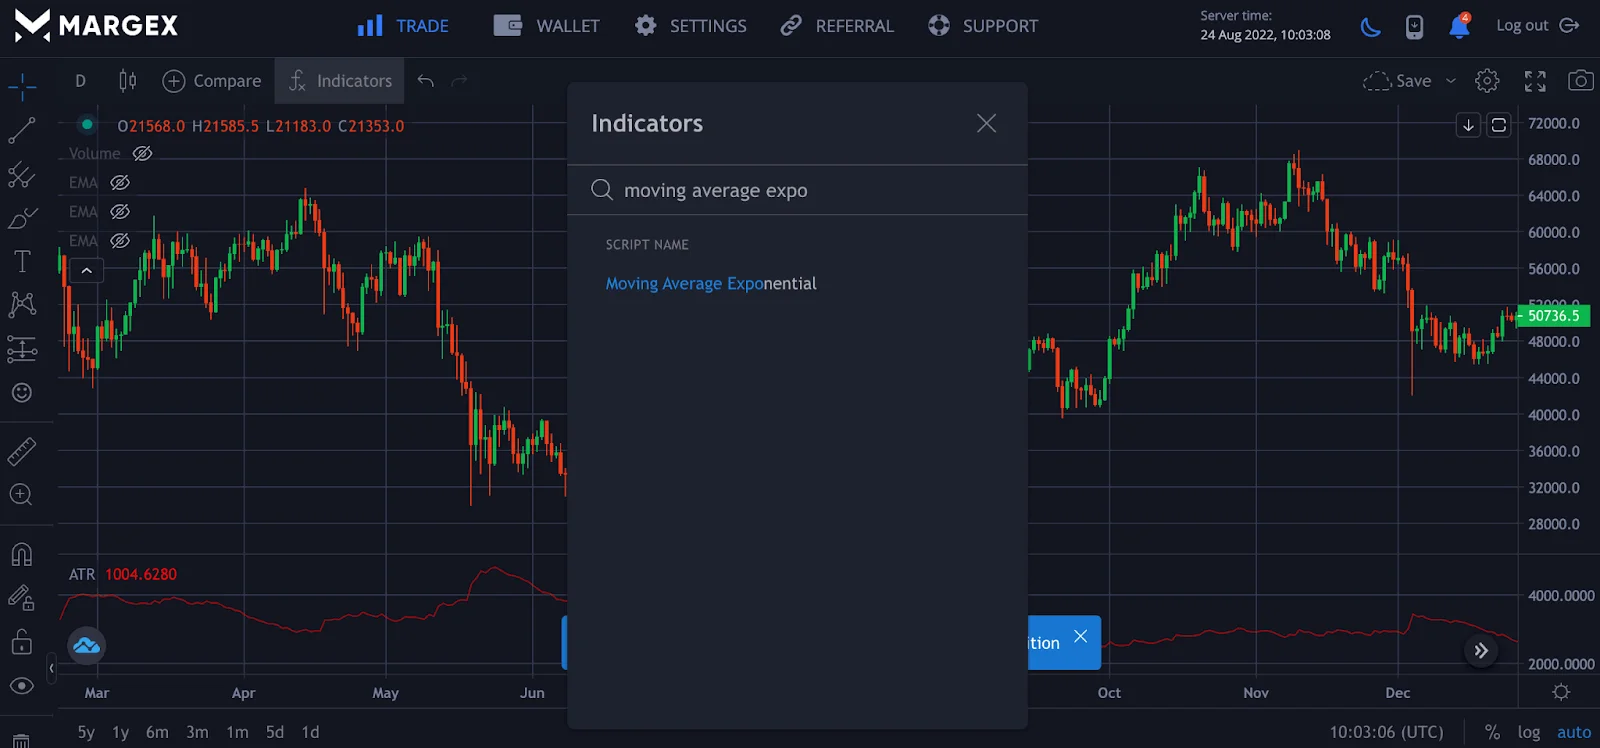
To use this indicator tool, we need to click on it three times since we are using the triple moving average, as the name implies. This will enable you to use the indicator while trading. It is essential to note the default value for the moving averages is the 9-day moving average. You would need to adjust the settings to suit your trading strategies.
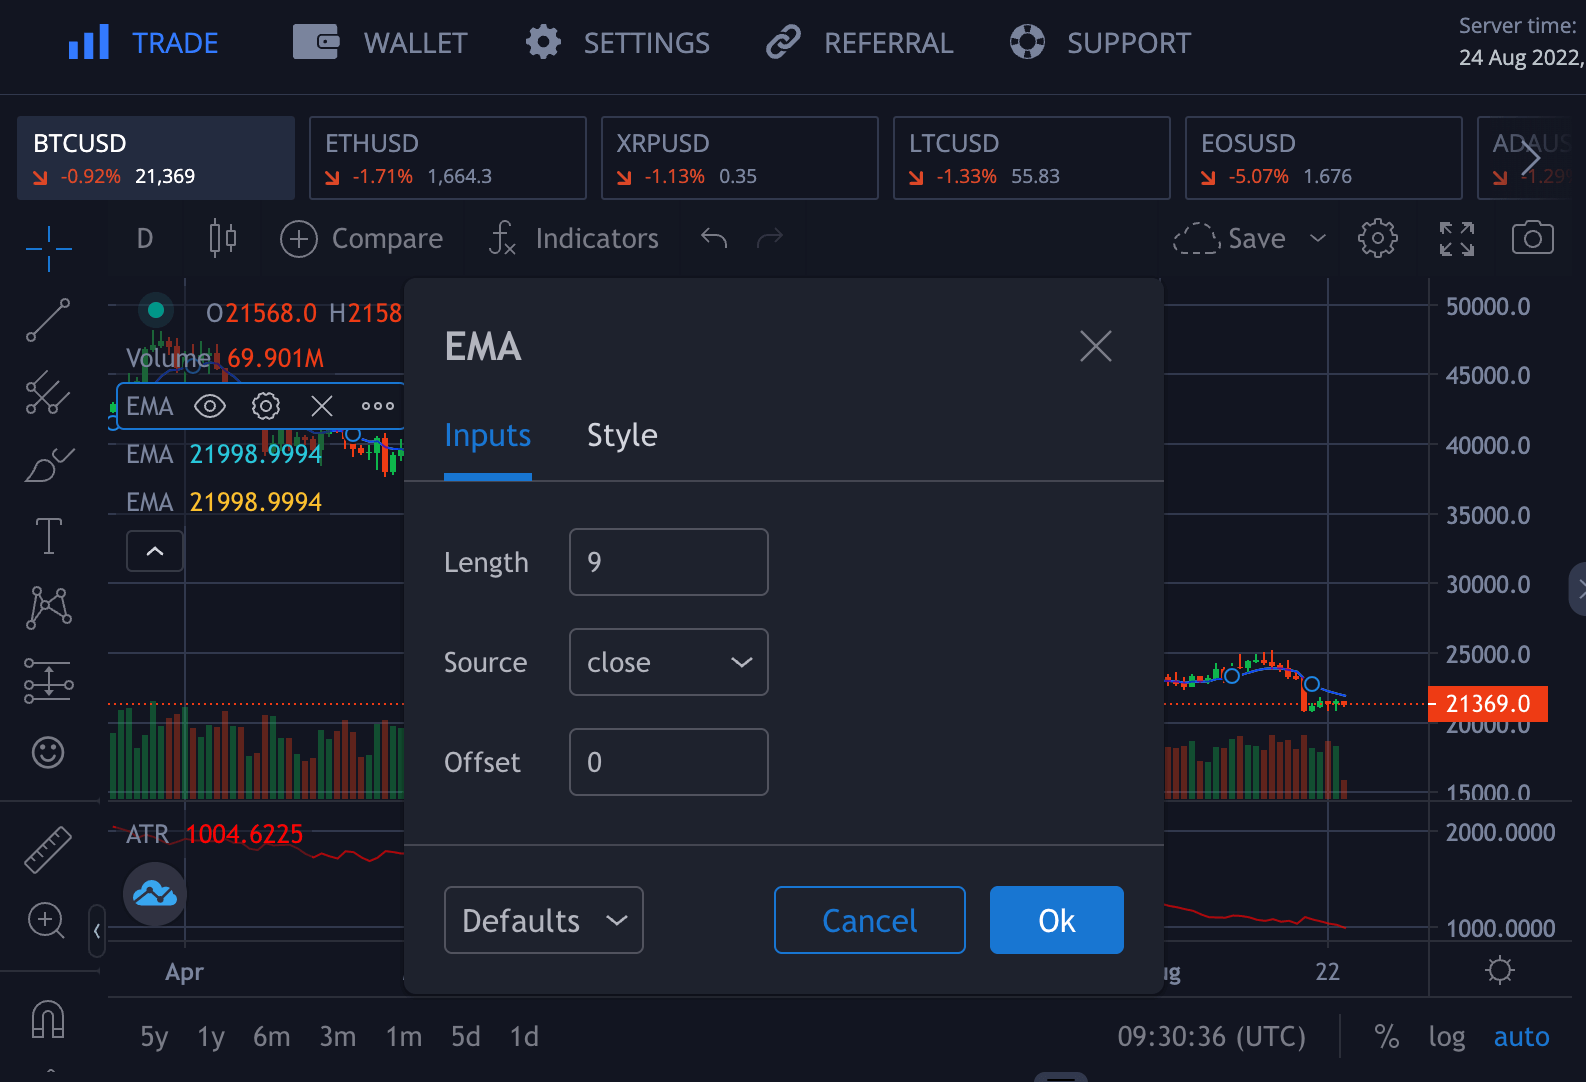
Hover on the left side of the screen where you see EMA, and click on the settings Icon to make the adjustment and color style of these moving averages from appearing as a single moving average. Once the adjustments have been made with the help of the settings, you will have some like this below.
For the above triple moving averages, we would use the 8-day, 13-day, and 21-day triple moving average crossover. Depending on your personality and the timeframe you wish to trade, this is usually used to spot a short-term trend.
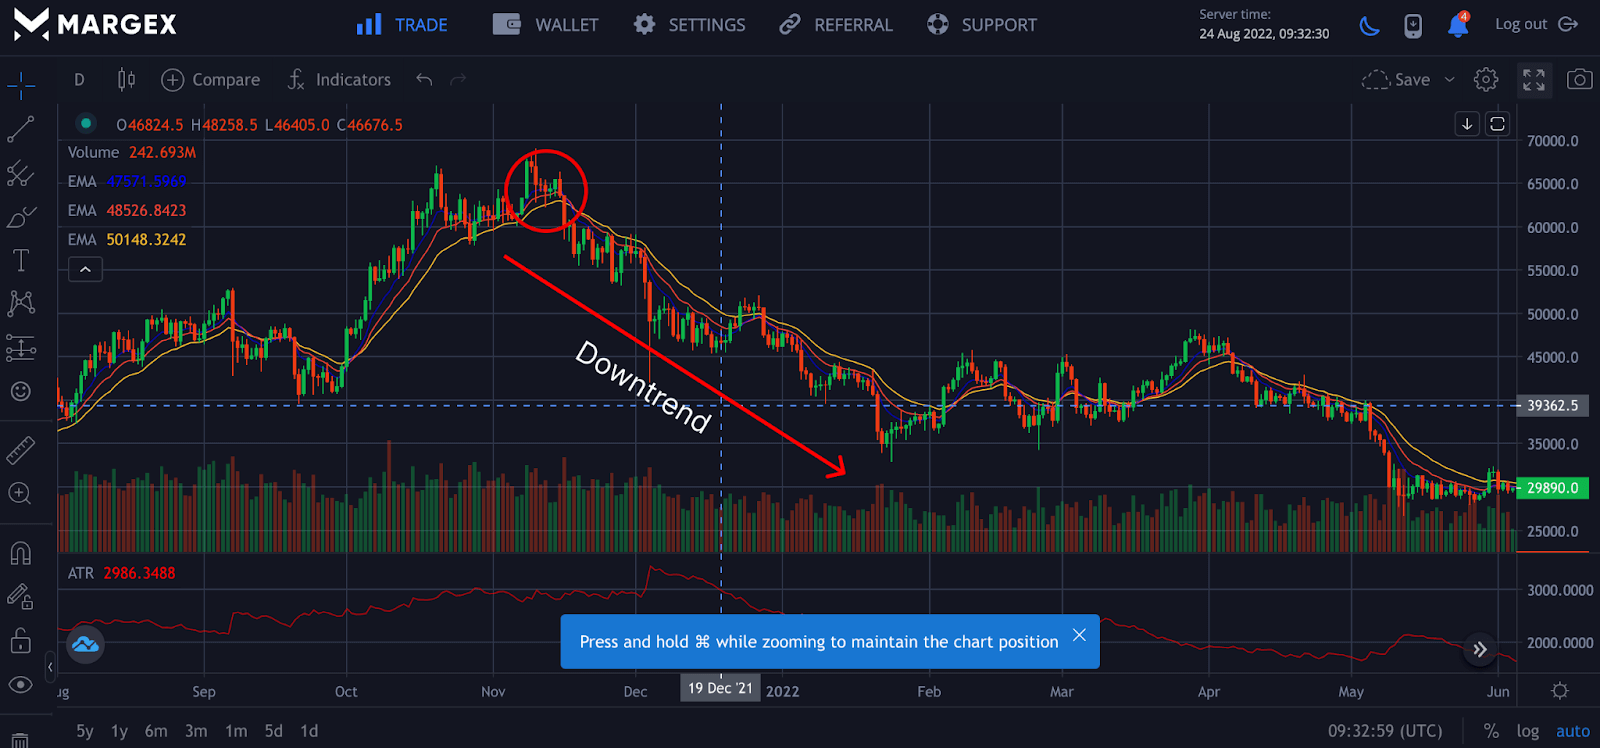
The fastest moving average, which is 8-day, moves and reacts faster to the market’s price action by crossing downward 13-day and 21-day moving averages.
On confirmation of the triple crossover indicated by the circle, this led to a downtrend. You can enter a short leverage position or sell position on a clear confirmation of the triple moving average crossover from upside to downside. This strategy needs back-testing to achieve what works best for you as a trader using the 3 moving average crossover strategy.
The triple moving average here acts as a resistance for the price; breaking the triple moving average to the upside indicates a change in trend and invalidates the setup.
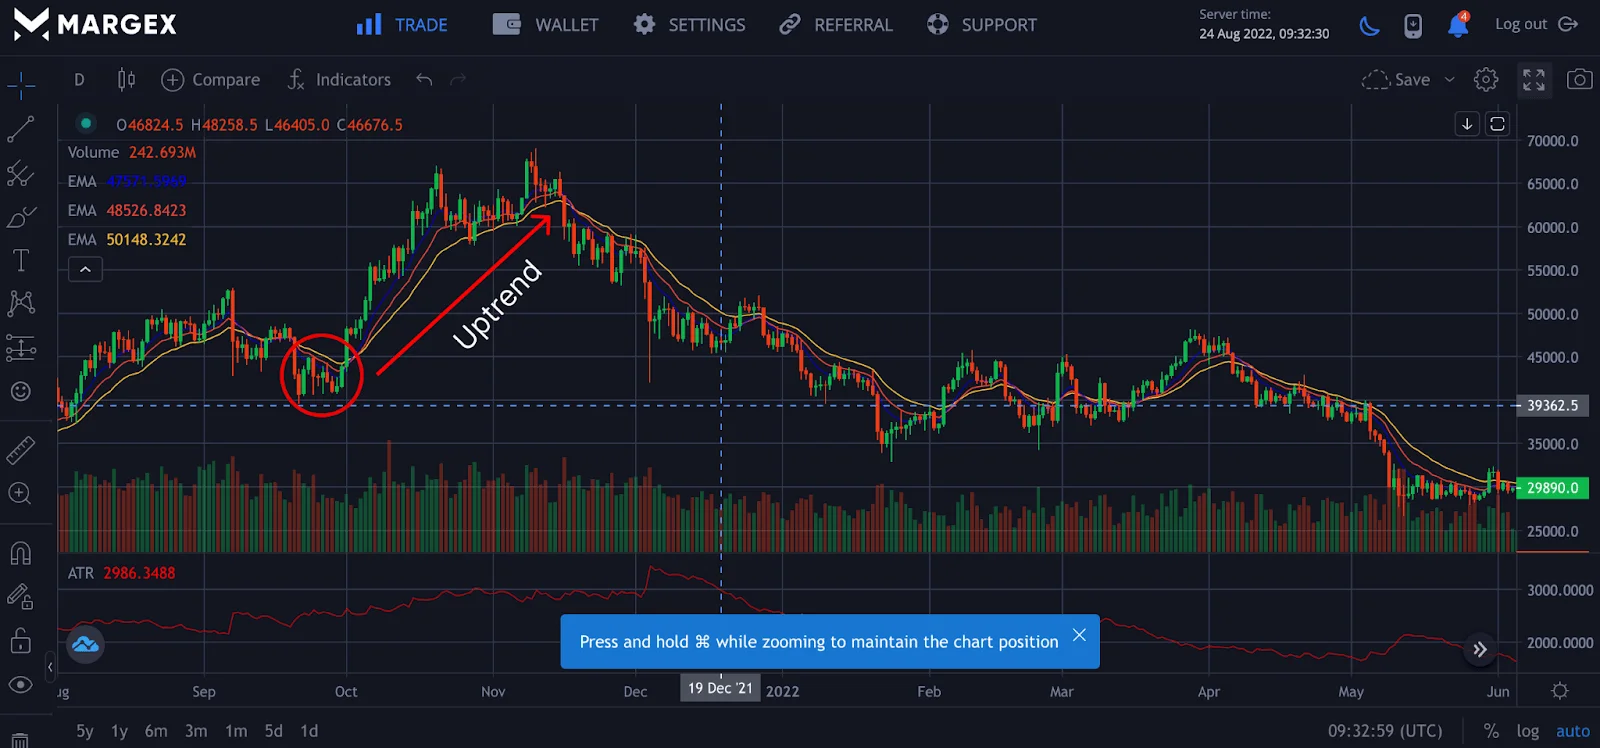
On confirmation of the triple crossover indicated by the circle, this led to a bullish trend. You can enter a buy or long leverage position on a clear confirmation of the triple moving average crossover from downside to upside.
The triple moving average here supports the price; breaking the triple moving average to the downside indicates a change in trend and invalidates the setup.
A breakout and retest of these triple moving averages can serve as our entries and exit to maximize profit opportunities and minimize loss.
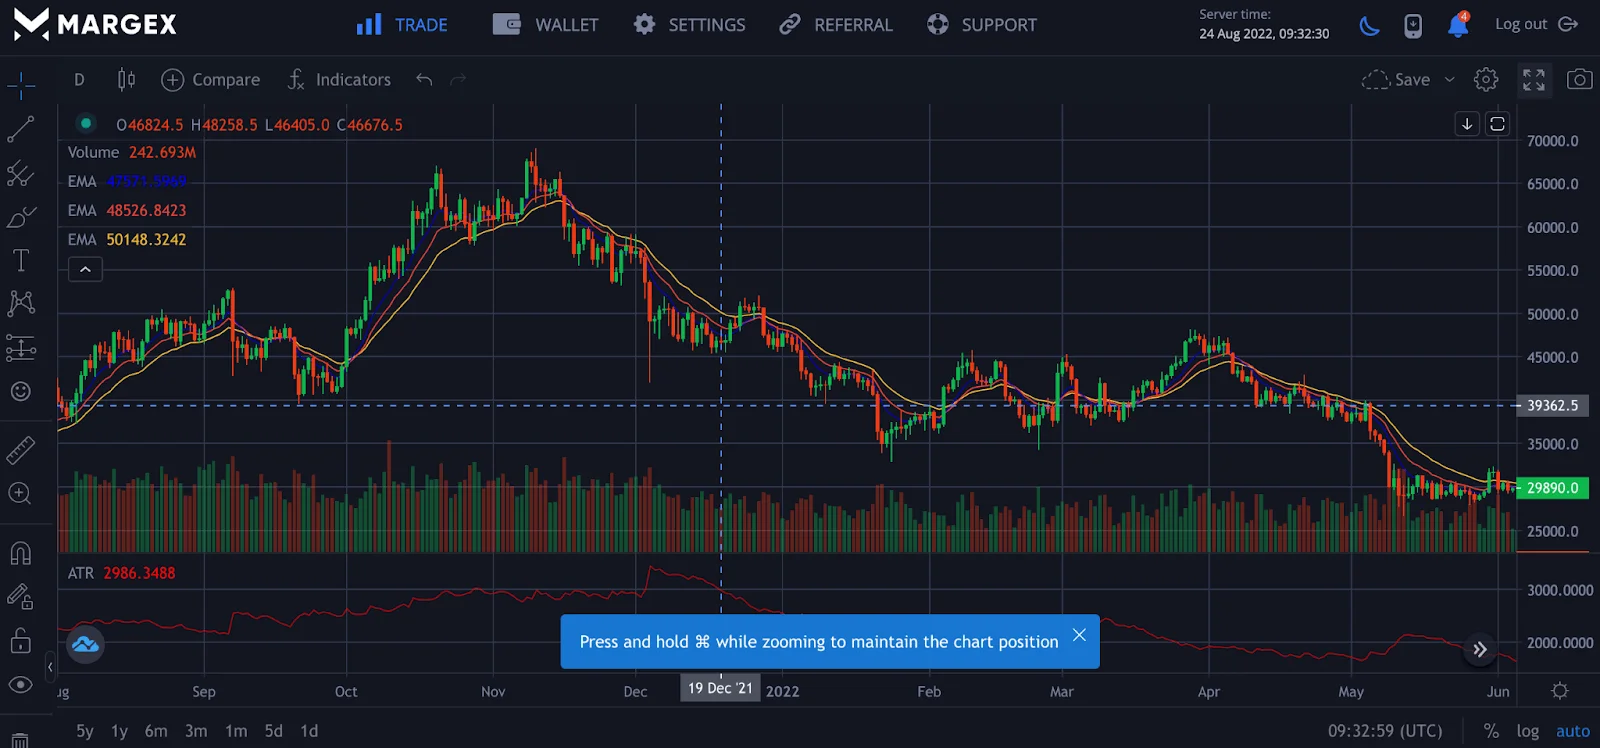
For long-term trends, it is good to use the 8-day, 50-day, and 200-day moving averages for more accuracy and ride bigger market trends.
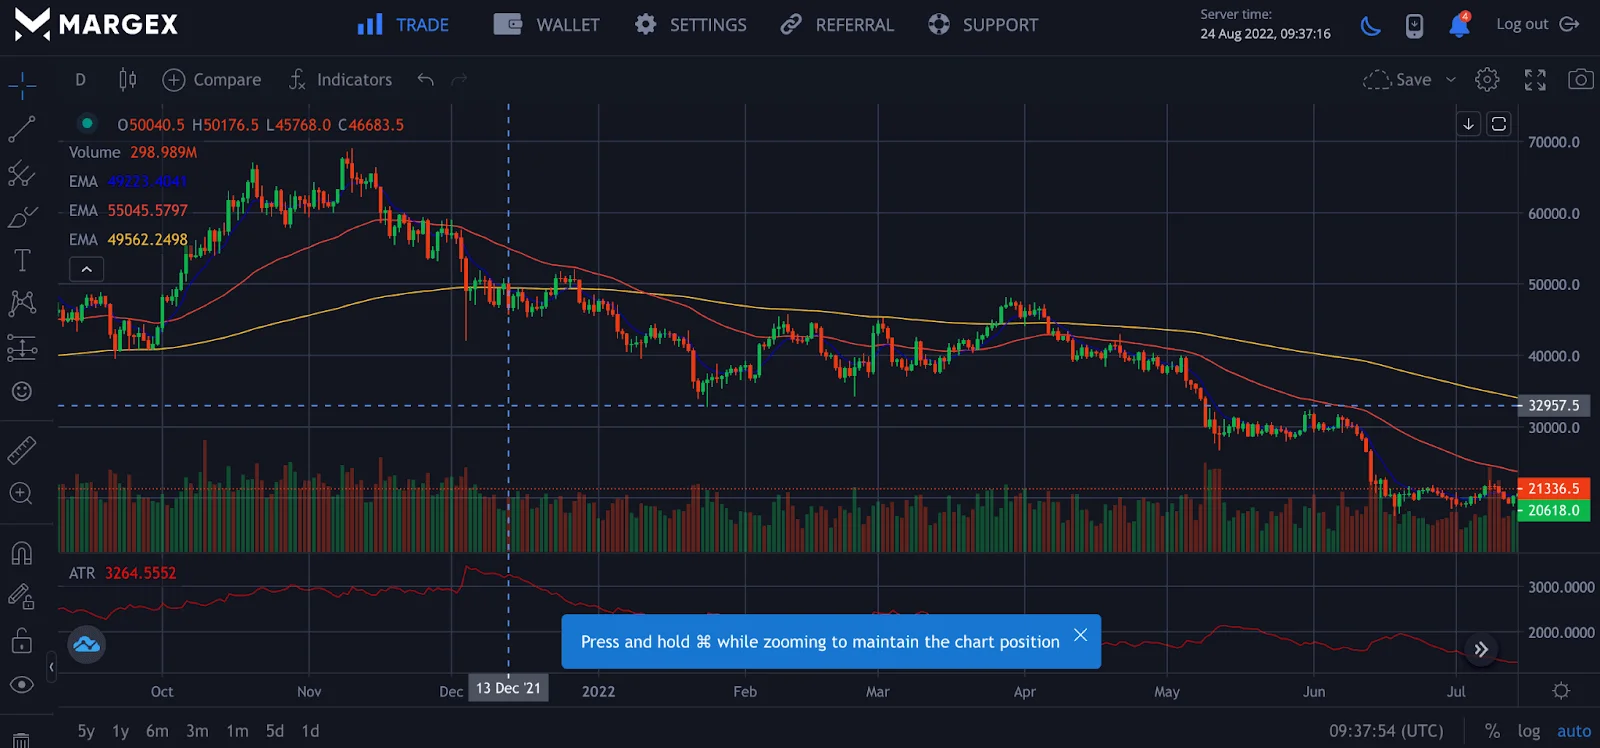
From the image, the BTCUSD pair has been downtrend using the triple moving average of (8,50,200). Depending on the timeframe, prices trading below these averages suggests a downtrend, while prices trading above these triple averages indicate an uptrend.
It is best to combine this trading tool with other strategies for optimal output return on investment for better trading opportunities.
What Is The Best Moving Average Crossover Combination?
Determining the best moving average crossover combination is very difficult as they serve different purposes for the different traders, and our choices in picking these values for moving averages differ.
Moving average crossovers are most effective in a trending market, not a ranging market; it would be good not to trade the moving average strategy in isolation. For better profitability, you need to combine these moving averages with other technical analysis tools for better accuracy.
FAQ
What is the best moving average crossover combination?
The best moving average crossover combination depends on your trading style and timeframe. Many traders use a 3 moving averages setup — for example, the 9 EMA, 21 EMA, and 50-day moving average. In this system, the shorter moving average (9 EMA) reacts quickly to price action, the medium (21 EMA) smooths fluctuations, and the longer (50 MA) defines the market trend. When the faster-moving average crosses above a slower-moving average, it generates a bullish signal (a mini golden cross). When it crosses below, it signals potential weakness. This moving average crossover combination helps traders spot entry and exit points based on trend strength.
What is the triple crossover method?
The triple crossover method is a trading strategy that uses three moving averages of different lengths — typically short-term, medium-term, and long-term. The idea is that when the shorter-term moving average crosses above the other two, it signals a potential trend reversal or strong uptrend. Conversely, when it drops below, it may confirm a bearish trend. This crossover system filters false signals better than a single moving average or two moving averages, as it uses multiple moving averages to confirm price movement and trend direction. The method is a core part of many EMA crossover strategies used in moving average trading.
What is the best triple moving average setting?
A popular and effective triple moving average setting is the 9 EMA, 21 EMA, and 50 EMA combination. These three exponential moving averages provide a balanced view of short-term momentum and longer-term trend direction. The 9-period exponential moving average tracks quick price movements, the 21-period EMA represents the medium-term trend, and the 50 EMA reflects the broader market trend. This triple moving average crossover strategy helps identify trade opportunities and improve entry and exit points by confirming when momentum aligns across all three EMAs.
What is the 3ma cross strategy?
The 3MA cross strategy (or 3 EMA crossover strategy) is a triple moving average crossover system that uses three EMAs to identify trend direction and potential entries. When the shorter moving average (like the 9 EMA) crosses above the medium (21 EMA) and longer (50 EMA), a bullish crossover occurs, suggesting an upward price movement. The opposite crossover indicates a bearish trend. This strategy uses three exponential moving averages to smooth price action, reduce noise, and make better-informed trading decisions. Traders often combine this with average true range or other indicators for volatility confirmation.
Triple moving average crossover meaning?
A triple moving average crossover refers to a strategy that uses three moving averages — short, medium, and long — to confirm trend changes. The crossover occurs when the shorter-term moving averages move above or below the slower-moving average, signaling either bullish or bearish trade opportunities. Because moving averages are lagging indicators, this system helps filter out false signals by waiting for alignment between all three moving averages. In short, it’s a trading strategy that uses multiple moving averages to define the market trend, find entry and exit points, and trade with the trend rather than against it.


