
The study of technical analysis involves comparing past price movements and using the learnings to attempt to anticipate and predict future price action.
What began as studying prices on paper “tape” and hand-drawing trend lines evolved into advanced computer software for analysis and a wide range of complex technical indicators.
Among those technical analysis tools is the MACD indicator, which can be used to generate a buy signal or a sell signal depending on market momentum. It also can help tell a trader when a cryptocurrency or other asset is overbought or oversold.
Read the following in-depth MACD crypto trading guide, complete with details on the tool’s definition, how MACD works, its calculation, and how to use it to trade crypto.
MACD Indicator Definition: What Is MACD In Crypto?
MACD stands for the Moving Average Convergence/Divergence indicator for short. It is a trend-following momentum indicator created by Gerald Appel in the late 1970s to analyze stock prices. However, the MACD indicator can be used reliably in commodities, forex, and cryptocurrencies.
The MACD is a popular technical analysis tool and as a result has become a cornerstone of an effective crypto trading strategy.
The tool is an unbounded oscillator consisting of an MACD line, a nine-period exponential moving average (EMA) acting as a signal line, and a histogram.
How Does The MACD Work? MACD Indicator Explained
The MACD line is the sum of a long-term EMA subtracted by a short-term EMA. The signal line is then plotted over the MACD line. When the two lines converge and diverge it can signal an asset is overbought or oversold, or that a trend change and reversal could be coming.
When the two lines crossover, it can act as a powerful trading signal that a change in momentum has potentially occurred.
MACD Formula: What Is MACD Indicator Calculation?
The formula for MACD is:
MACD = 12-Period EMA − 26-Period EMA, which helps to illustrate the relationship between the two moving averages.
The MACD line is calculated by subtracting the 26-period EMA from the 12-period EMA.
Exponential moving averages give greater weight to recent price data, making them essential for calculating the EMA of the MACD.
The formula for EMAs is: the ema of the macd line calculated from two moving averages.
EMA = Closing price x multiplier + EMA (previous day) x (1-multiplier), which is essential to calculate the MACD.
According to Investopedia, “the MACD has a positive value whenever the 12-period EMA is above the 26-period EMA and a negative value when the 12-period EMA is below the 26-period EMA.”
The MACD histogram formula is:
Histogram = MACD line – Signal line
The difference in these lines is represented visually using the histogram.
MACD Settings For Crypto Trading
Unfortunately, there are no special settings for the MACD to apply to crypto or other markets like there is for the Ichimoku and several other technical indicators. However, traders are always welcome to experiment. Be sure to backtest any trading strategies before using capital to trade, especially those involving the EMA of the MACD.
How To Interpret MACD Signals And How To Read MACD Charts
Reading MACD cryptocurrency price charts can become second nature with some familiarity and practice using the indicator to identify market trends.
Line crossovers can be used to generate a buy or sell signal. A bullish cross occurs when the MACD line crosses the signal line from below, while a bearish cross occurs when the MACD line crosses the signal line from above. MACD crosses can be a powerful signal to enter a position.
If the MACD line and signal line are rising together the momentum is bullish and if they are falling the momentum is bearish. If the lines are diverging, it suggests an asset is overbought or oversold, which can be confirmed by the MACD and the signal line. If the lines are beginning to converge it could lead to a crossover.
If the histogram lines are growing, a trend is gaining in strength. If the histogram lines are shortening, the trend could be weakening and a trader can anticipate a possible trend change.
What Is MACD Divergence? How To Use MACD To Trade Divergences
The MACD histogram is a visual tool that represents the difference between the MACD line and the signal line. The histogram grows as the speed of price movements increase in momentum and trends strengthen, indicating when the histogram is positive and suggesting potential buy signals. When the histogram decreases, a trend, momentum, and the speed of price movements could be weakening.
A divergence can appear on the histogram if price action doesn’t move in the same direction of the indicator. For example, a bearish divergence appears when price is making higher highs, while the MACD is making lower highs. A bullish divergence appears when price is making lower lows, while the MACD is making higher lows.
Divergences can be found by drawing trend lines across a series of swing highs or swing lows to better understand if any discrepancies between price and the technical indicator exist. Trading divergences can be tricky and isn’t recommended. Divergences are only confirmed in hindsight and can lead to traders being faked out or chopped up, especially when the value of the MACD line is misinterpreted.
Reading MACD divergences, however, can tip a trader off about a potential trend change, allowing the trader to prepare accordingly and look for supporting signals and patterns that could confirm the setup.
Example Of How To Use MACD In The Crypto Market
Here is an example of how to use the MACD to trade cryptocurrencies like Bitcoin, Ethereum, Litecoin, XRP, and other altcoins.
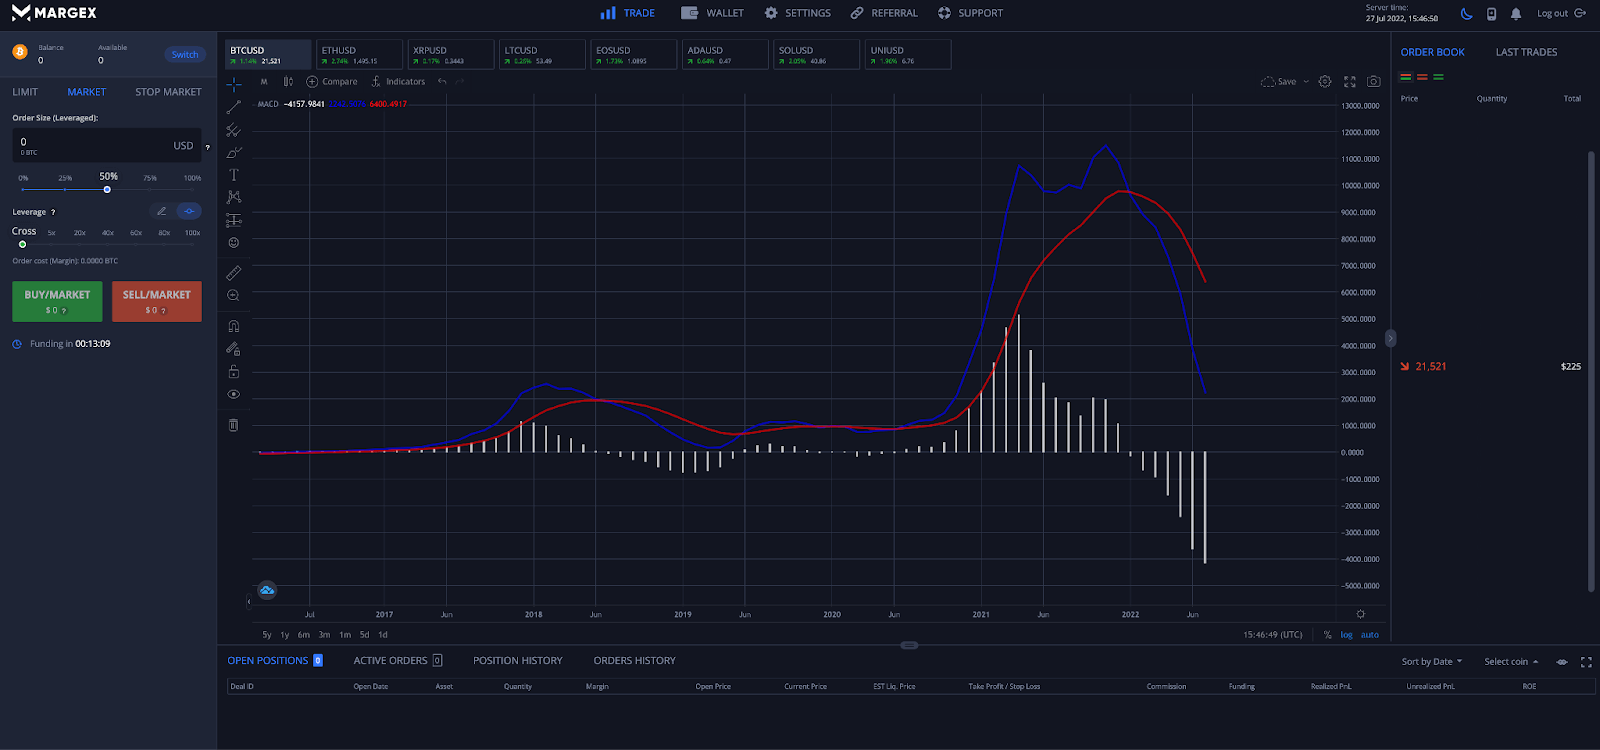
In the BTC example above, the MACD is converging at the zero line. Either the MACD will cross bearish and prices will fall, or the MACD may diverge from here and prices will soar higher with increasing momentum.
It is then important to consider the rest of the picture from a technical analysis standpoint. Bitcoin is also supported by a minor uptrend line (orange dashed line) and there is a possible bull flag. If price collapses below the trend line with a bearish crossover, more downside should be confirmed. If price pumps and the MACD diverges, significant upside could follow, indicating strong buy and sell signals.
Advantages And Disadvantages Of Using MACD
Like any tool, there are always upsides and downsides to using them. Some indicators give false positive signals, lag behind trend changes, or create other issues.
Here are some of the most common advantages and disadvantages of using the MACD indicator:
MACD Crypto Trading Pros
✔️Measures momentum
✔️Easy to read, the MACD indicator provides clear buy and sell signals for traders.
✔️Follows the trend
✔️Clear buy or sell signals
MACD Crypto Trading Cons
❌Lagging indicator
❌False signals
❌No custom settings; however, traders often prefer to use the simple moving average.
How To Trade With MACD Indicator On Margex
The Margex trading platform offers built-in technical analysis tools that the pros rely on, like the RSI, Ichimoku, Bollinger Bands, Fibonacci tools, and the MACD. Here is a step-by-step guide on how to use the MACD to trade crypto with Margex.
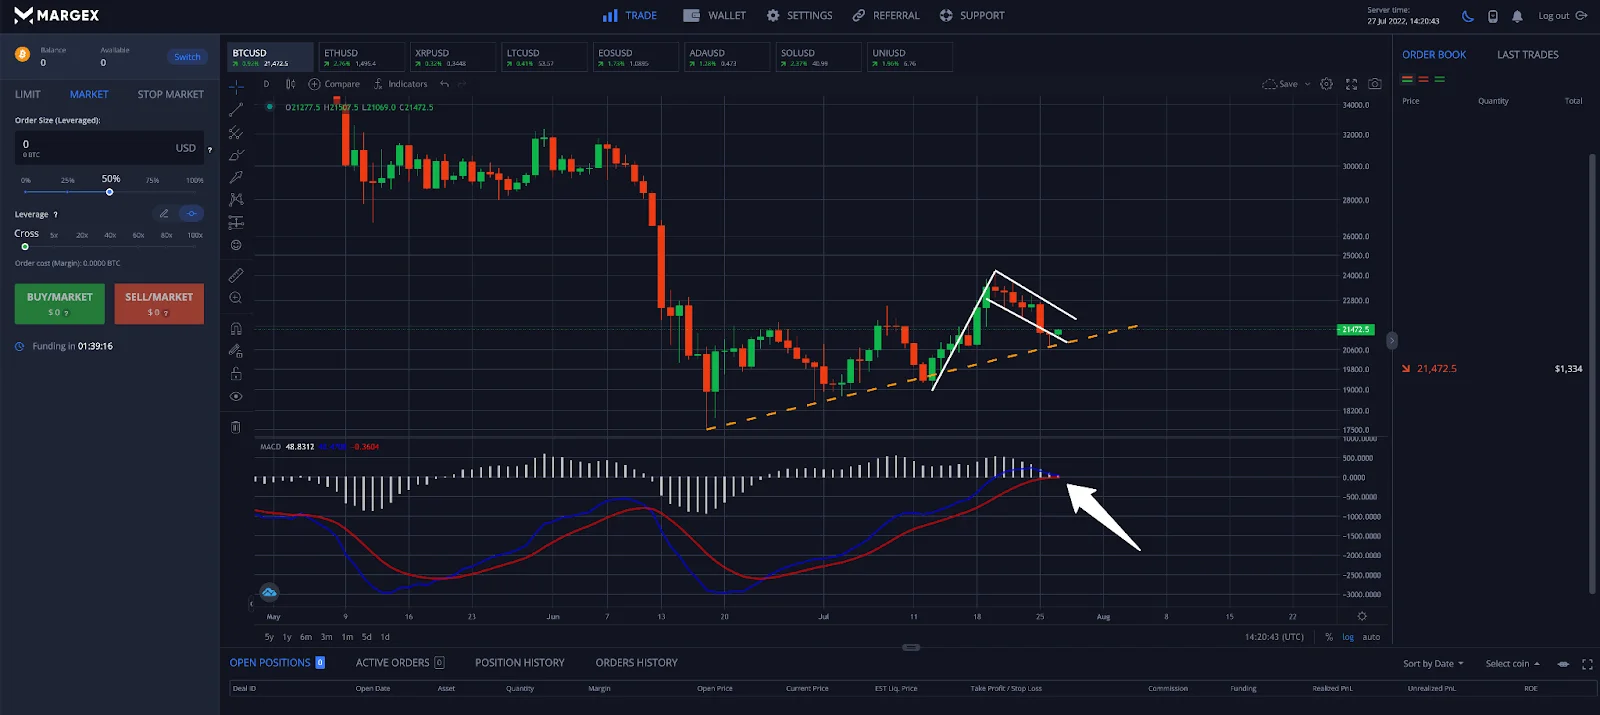
Step 1 – Turn on the MACD and highlight any bearish or bullish crossovers. Note: Crossovers are better signals if they appear as a trend line is breached (pictured), especially when considering the MACD and the signal.
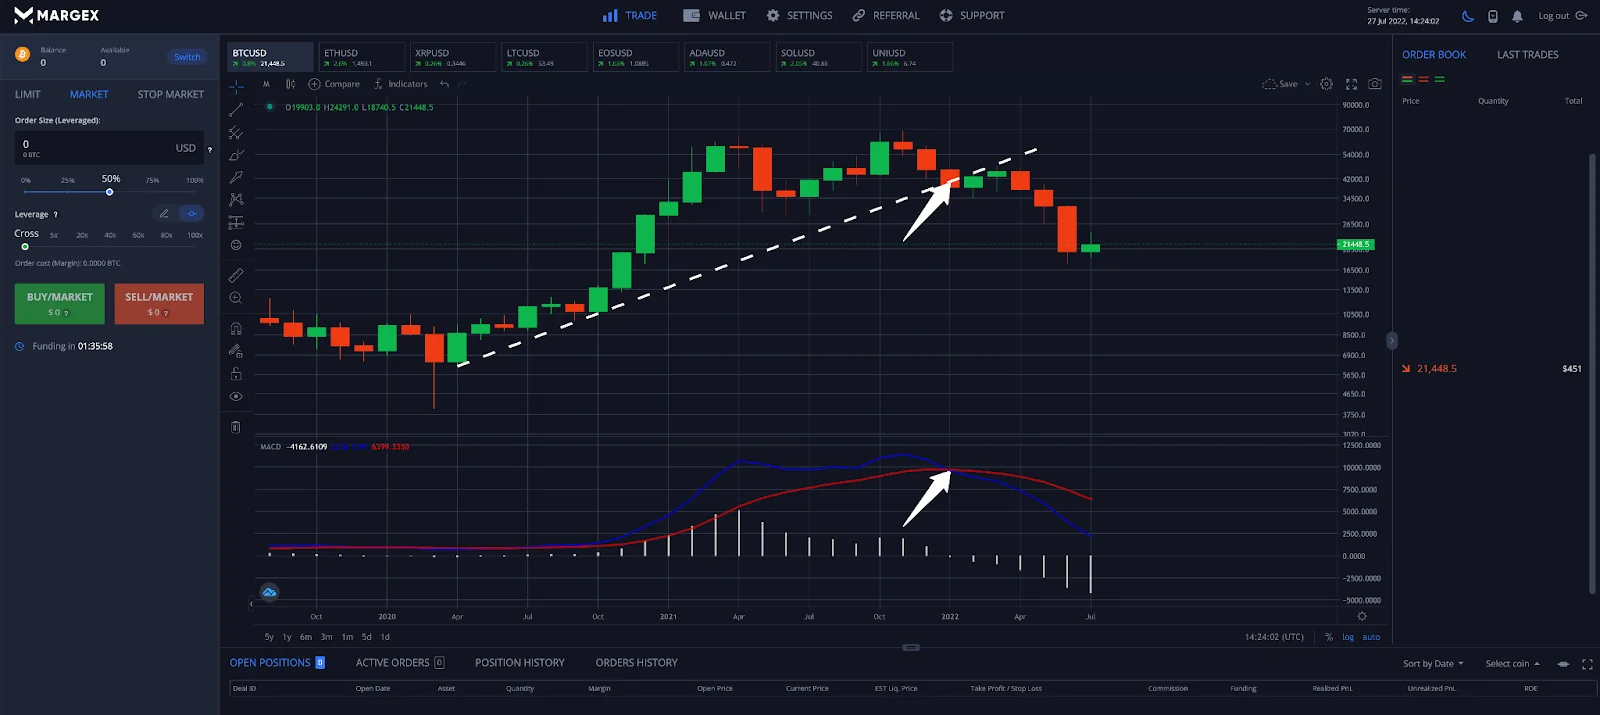
Step 2 – Because this is a bearish crossover on weekly timeframes, it is a signal the uptrend is over and it is time to sell. A trade would be entered either after the two lines have crossed, thus commencing a new downtrend.
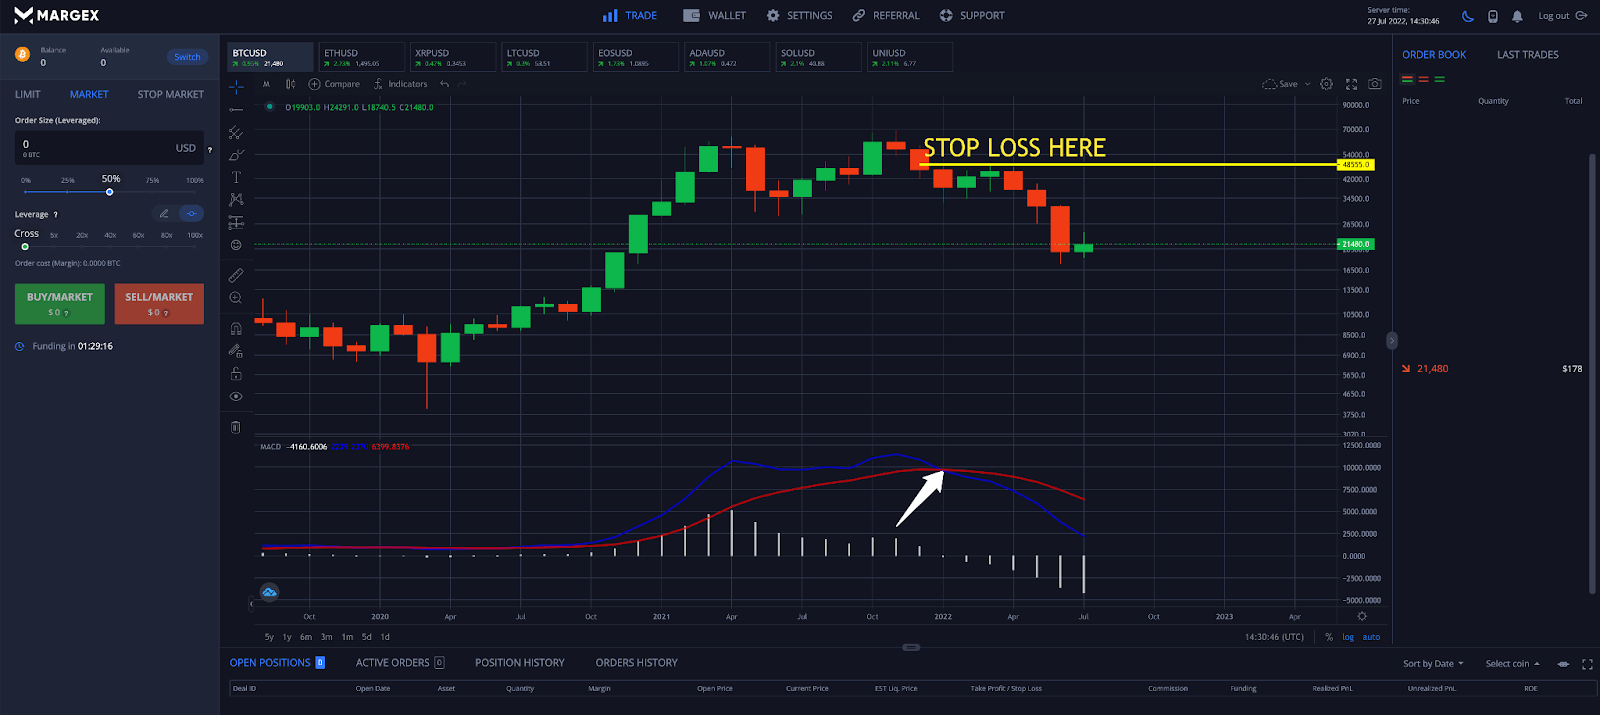
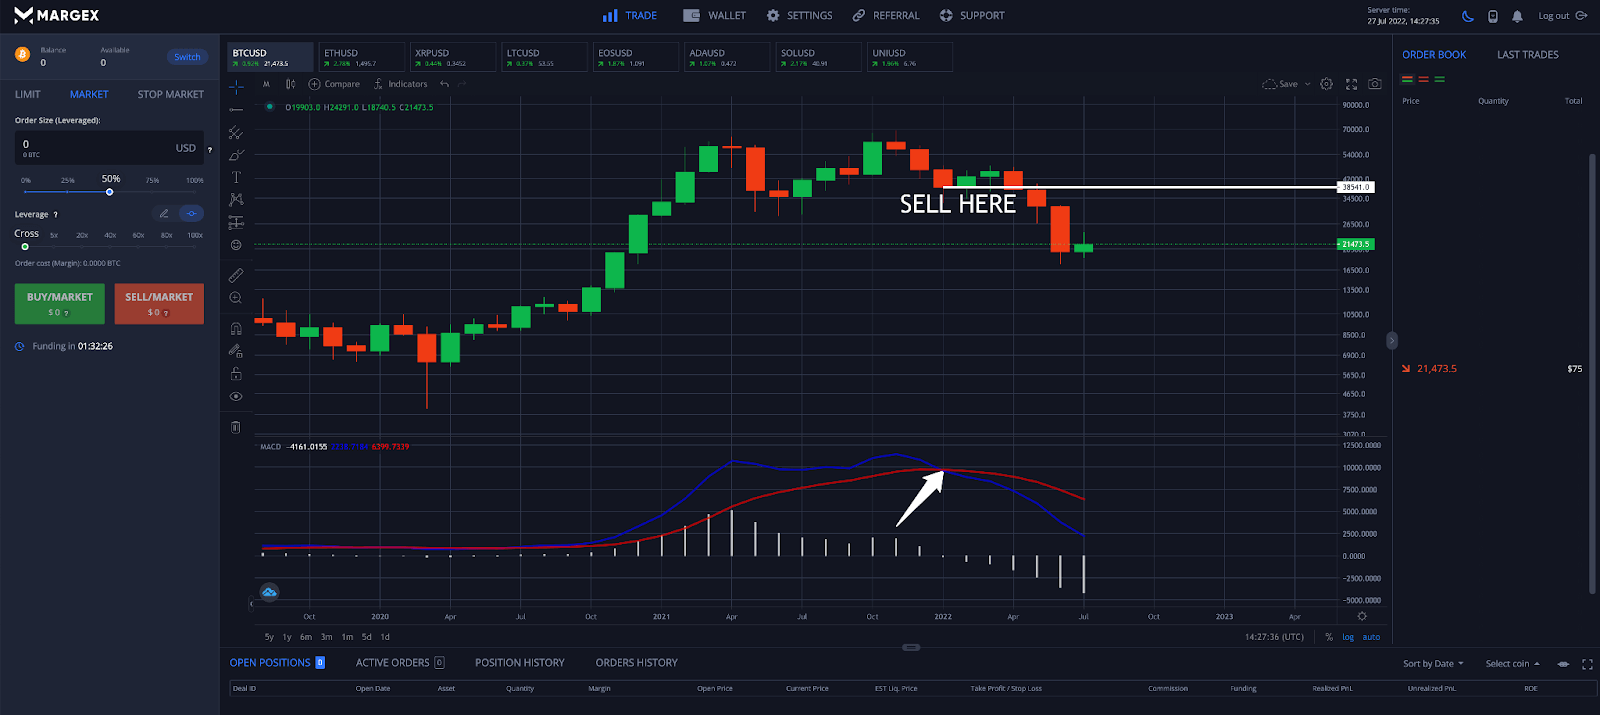
Step 3 – Place a stop loss order above the candle where the crossover occurs when the MACD crosses bearish. BTC dropped another 50% from where the sell order was placed and the stop loss was never triggered.
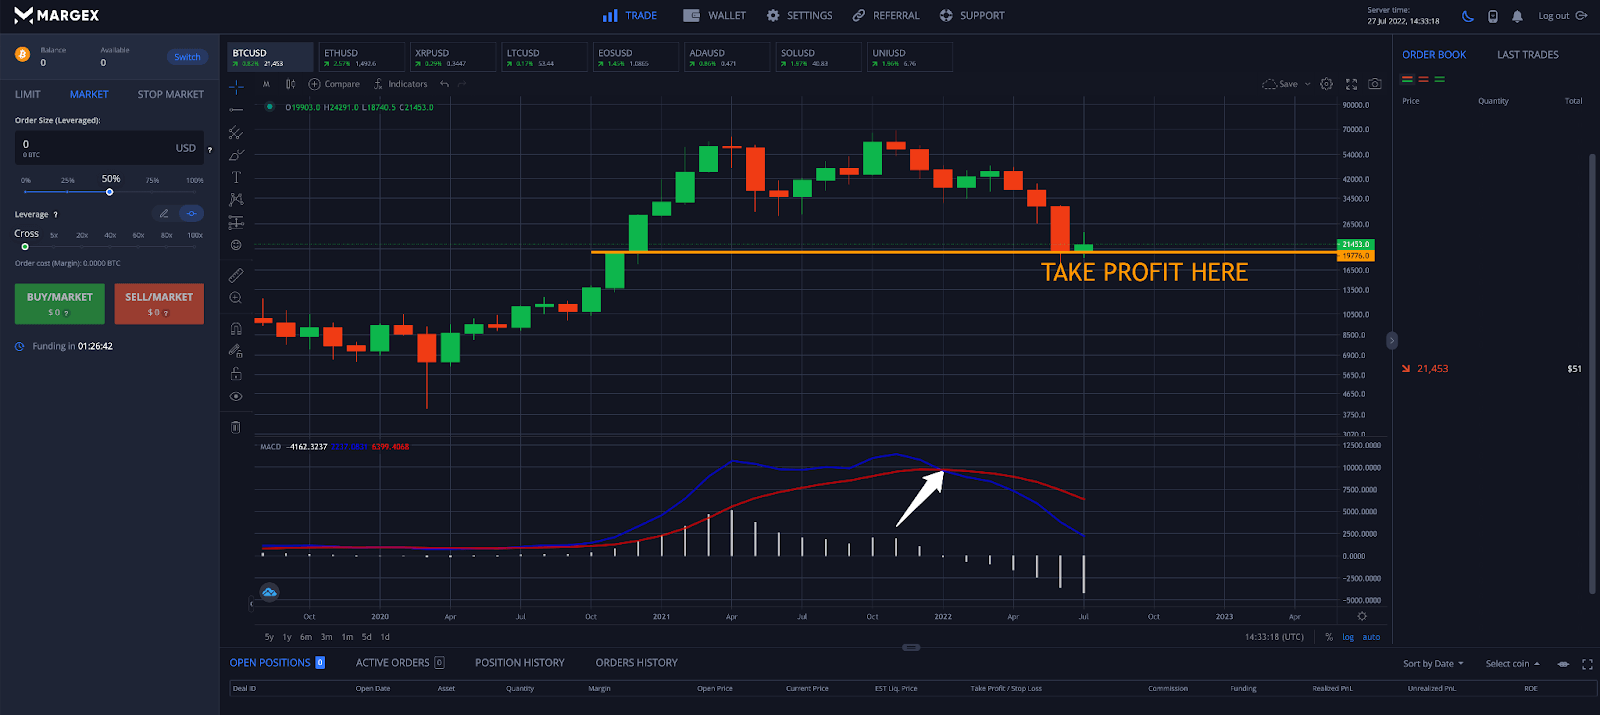
Step 4 – Traders should plan to take profit at key targets accordingly. Alternatively, a trader can wait for a bullish crossover to close any positions. However, because the MACD is a lagging indicator this isn’t recommended.
How To Avoid False MACD Signals: Understanding MACD Lagging Signals
The MACD is a trend-following momentum indicator. This means at times the trend will have changes prior to the MACD providing a crossover or signal. This has given the MACD a notorious reputation as a lagging indicator. Many argue that the MACD isn’t a great tool to trade with, while others swear by it in their toolset, claiming it helps them identify buy and sell signals effectively.
However, there are several ways to utilize the MACD effectively. The MACD is a great tool for spotting divergences. Positive divergences aren’t signals to actively trade on, but they can tell a trader a trend change might be coming and the trader can prepare accordingly.
The MACD also works well in conjunction with other technical indicators, such as the RSI, Stochastic, Bollinger Bands, and more, enhancing the analysis provided by the moving average of the MACD. Traders can look for possible Japanese candlestick patterns or watch for MACD crossovers at support or resistance to further improve results of using the tool.
MACD Versus Relative Strength Index (RSI)
The RSI indicator and the MACD indicator are two of the most commonly used momentum indicators used by crypto traders. Although they both measure momentum and the velocity of a price movement, the way each tool provides signals is different.
The Relative Strength Index (RSI) indicates when an asset is overbought or oversold in relation to recent price action and can be used alongside the moving average of the MACD. The RSI takes the average gains and losses over 14-periods by default. Traders can experiment further with custom RSI settings.
The MACD is an unbounded oscillator while the RSI is range-bound between a scale of 0 to 100, allowing traders to compare different indicators for better buy and sell signals. A RSI reading of over 70 is considered overbought while a reading below 30 is considered oversold. Readings of below 50 are bearish while readings of above 50 are bullish. Because cryptocurrencies are speculative assets, they can remain overbought or oversold for extended periods of time compared to other assets.
The MACD measures the convergence or divergence between the MACD line and the signal line, while the RSI focuses on average price gains and losses during a timeframe; both can be used to identify potential buy and sell signals. Because the two indicators work differently, they can generate mixed signals. However, when the two technical indicators are giving similar signals, traders have additional confirmation and a higher probability of a profitable trade setup.
FAQ
How to use MACD indicator in crypto?
The Moving Average Convergence Divergence (MACD) is calculated by subtracting the 26-period exponential moving average (EMA) from the 12-period EMA to determine the value of the MACD line. The MACD line and the signal line (nine-day EMA of the MACD) help traders use crossovers to identify momentum shifts. For example, when the MACD line crosses above the signal line, it can indicate a potential buy, while crossing below the signal line may suggest a sell. The MACD histogram shows the difference between the MACD and its signal, helping traders analyze market volatility and make trading decisions.
Is MACD good for crypto?
Yes, MACD is often considered a useful momentum indicator in crypto trading strategies. Since the crypto market is volatile, the MACD indicator can help identify bullish signals and bearish reversals through crossovers, divergences, and the histogram. While not a leading indicator, it provides valuable insights into price momentum and can be combined with other tools to improve accuracy.
What is the most accurate indicator for crypto?
There isn’t one single “most accurate indicator” for crypto, as market conditions vary. The MACD indicator is widely used because it measures the relationship between two EMAs and can help identify potential buy and sell signals. However, traders often combine MACD with other indicators such as RSI or volume analysis to confirm trading signals and manage risk.
What does the MACD indicator tell you?
The MACD indicator tells you about the momentum and trend direction of a crypto asset. When the MACD line crosses the zero line, it signals a shift in momentum. A line crossover above the signal line is typically seen as a bullish signal, while crossing below may indicate bearish momentum. MACD divergence (when the price moves in the opposite direction of the MACD line) can also warn of potential trend reversals. In short, MACD signals provide traders with insights into when to enter or exit trades.


