
Bitcoin traded under $108,000 on Tuesday after losing ground from a brief rebound earlier in the week. The drop came as sellers stepped in near a key resistance line, signaling renewed pressure on the market.
The slide followed Monday’s short-lived rally, when Bitcoin reclaimed $111,000 and closed the day with a 1.7% gain. But risk sentiment quickly faded as concerns grew over the prolonged U.S. government shutdown and the latest flare-up in U.S.-China trade tensions.
The Senate rejected a vote to reopen the government for the 11th time, extending the closure into its third week. Investors fear the deadlock could weigh on growth and delay key policy decisions.
White House economic adviser Kevin Hassett told CNBC the standoff “is likely to end sometime this week,” but hinted stronger measures may follow if talks fail.
Meanwhile, President Donald Trump said over the weekend that a “fantastic” trade deal with China was still possible yet warned that tariffs on Chinese goods could rise to 155% if negotiations break down.
The mix of political gridlock and trade uncertainty has cooled demand for risk assets, including Bitcoin, which remains vulnerable to broader market sentiment.
Institutional demand for Bitcoin showed further signs of slowing.
Data from SoSoValue recorded $40.47 million in outflows from spot Bitcoin exchange-traded funds (ETFs) on Monday, marking the fourth straight day of withdrawals since mid-October.
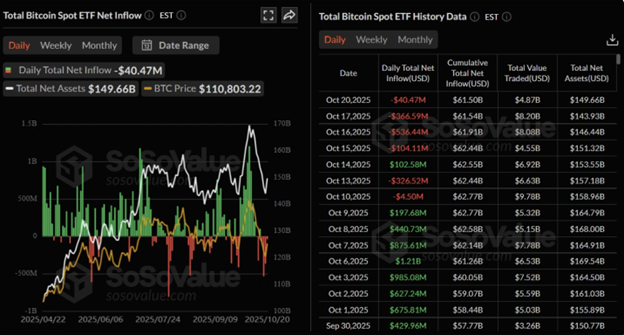
The streak follows last week’s second-largest weekly outflow since the ETFs began trading, hinting at a more cautious stance among professional investors.
The pullback comes as broader macro uncertainty weighs on risk assets. With institutional inflows fading, Bitcoin’s short-term outlook remains under pressure heading into the second half of the week.
Bitcoin Price Prediction: Why Is Bitcoin’s Long-Term Trendline So Important Right Now?
At the same time, Bitcoin (BTC) is holding near what analyst Ali Martinez calls its “most important support trendline.”
The level has defined the coin’s bull market since late 2022, surviving every major correction over the past two years.
Martinez’s weekly chart shows BTC repeatedly bouncing from this rising line now positioned between $100,000 and $105,000 during past downturns. #
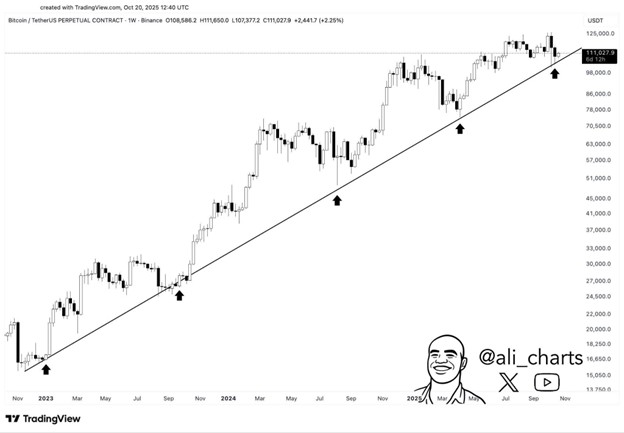
Each recovery from this zone, including in September 2023, March 2024, and May 2025, sparked new rallies and confirmed the strength of the ongoing uptrend.
As of press time, Bitcoin traded around $111,000, showing a mild rebound after testing the lower end of the trendline earlier this month. Analysts say maintaining this support remains key to keeping the broader bull cycle intact.
Bitcoin is testing a key trendline that has defined its two-year rally, but the move comes at a fragile moment.
Data from Arkham Intelligence shows that the so-called $10 billion “Hyperunit Whale” the trader who earned $200 million during the China Tariff Crash has doubled down on shorting Bitcoin.
The whale now holds a $234 million short position with a liquidation level near $123,000, signaling renewed institutional caution about Bitcoin’s ability to hold above current prices.
From a technical view, losing this long-term support could trigger a deeper pullback. The next major demand zones are near $98,000 and $86,000 levels tied to earlier consolidation phases.
On the other hand, a weekly close above $110,000–$112,000 could restore bullish confidence and open a path toward $125,000 and $138,000 over the next few months.
Momentum readings remain divided. The RSI has cooled from earlier highs, showing exhaustion after months of steady gains. Still, the broader pattern looks more like an extended accumulation range than a market top.
In short, Bitcoin sits at a crossroads. Bulls need to defend this trendline to keep the cycle intact, while large short positions are raising volatility. The coming weekly close will likely decide whether Bitcoin’s uptrend holds or finally breaks down.
Meanwhile, traders are watching Bitcoin’s battle with its Bull Market Support Band the area defined by the 20-week SMA and 21-week EMA, now between $110,000 and $114,000.
Could a Weekly Close Above the Support Band Trigger a Rally Toward $125K?
According to analyst Daan Crypto Trades, Bitcoin slipped below this zone but is trying to reclaim it, a move that often separates bullish continuation from broader correction phases.
Adding to the tension, Arkham’s data confirms that the same Hyperunit Whale has reinforced bearish bets, amplifying uncertainty as Bitcoin hovers near a cycle-defining support.
“Bitcoin ($BTC) has slipped below its Bull Market Support Band and is now trying to reclaim it,” analyst Daan Crypto Trades wrote, noting that similar dips occurred earlier this year and last summer without breaking the broader uptrend.
But he cautioned, “If the price can’t regain the band within a few weeks or keeps sliding lower, that’s a sign of weakness for me.”
On the weekly chart, Bitcoin still holds a structure of higher highs and higher lows, keeping the long-term bullish setup intact.
Even so, repeated rejections near $120,000–$125,000 have limited upside moves. Trading volume is thinning, and momentum is flattening, signaling hesitation among traders.
Historically, staying above the Bull Market Support Band has marked strong rally phases seen in late 2023 and early 2025, while extended drops below it have often led to deeper corrections. For now, the $110,000–$112,000 range is the key zone traders are watching.
A weekly close above the band could restore confidence and spark a push toward $125,000 or even $135,000.
Failure to do so might trigger more liquidations, increasing the risk of a drop toward $98,000 or possibly $90,000, especially with large traders adding short positions.
Daan said it’s “too early to make a big fuss,” urging patience rather than panic. His view suggests the trend remains technically bullish, but the market is fragile.
The next few weeks could decide whether Bitcoin regains strength or enters a cooling phase heading into year-end.
SharpLink Expands Ethereum Holdings as BitMine Leads Accumulation Race
SharpLink Gaming (SBET) expanded its Ethereum treasury last week with a $75 million purchase of 19,271 ETH, the company said on Tuesday.
The move lifts the Minnesota firm’s holdings to 859,853 ETH.
SharpLink executed the trade at an average price of $3,892 per ETH, funded by a $76.5 million private offering. It also reported 458.9 ETH in staking earnings and $36.4 million in cash and equivalents.
The buying streak mirrors activity at BitMine (BMNR), which has stepped up accumulation during the recent market pullback.
On Monday, BitMine disclosed an addition of 203,826 ETH, its largest weekly purchase in October, bringing its reserve above 3.23 million ETH.
That’s about 2.7% of the asset’s circulating supply, placing BitMine among the biggest public holders.
Later the same day, Arkham Intelligence data showed BitMine picked up a further 63,539 ETH. The company has not confirmed that transaction.
While corporate treasuries add exposure, US spot Ethereum ETFs saw outflows.
According to SoSoValue data, the funds recorded $145.6 million in net redemptions on Monday, after $311.8 million flowed out the prior week.
The split signals a cautious fund market even as select corporates continue to build ETH positions. Traders will watch whether ETF outflows persist or reverse if the price stabilizes.
Ethereum Price Prediction: What Are Analysts Saying About Ethereum’s Consolidation and Volume Trends?
According to Coinglass data, Ethereum recorded $153 million in futures liquidations over the past 24 hours, including $80.1 million in short positions.
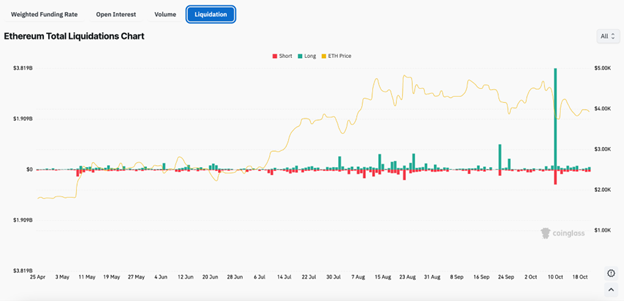
The token continues to struggle near the $4,100 mark, failing to clear it for the second day in a row.
Price action remains limited below the 50-day and 100-day Exponential Moving Averages (EMAs), which have converged as key resistance. Ethereum has faced similar pressure around this zone before, most notably through much of 2024 before finally breaking out on August 9.
For a clear bullish move, ETH needs to break above the $4,100 and $4,270 levels with strong volume support. Without that, a pullback toward $3,800 or even $3,470 remains on the table.
Technical indicators show mixed signals. The Relative Strength Index (RSI) and the Stochastic Oscillator are both hovering around neutral territory. This suggests that selling momentum is fading, but buyers aren’t showing strong conviction yet.
Crypto analyst Crypto Tony said Tuesday that Ethereum’s short-term outlook remains uncertain. His latest analysis points to a phase of consolidation that could precede a potential breakdown if bulls fail to regain control.
The four-hour ETH/USDT chart indicates that there is a wider descending wedge shape since the beginning of October, with the price movements narrowing around the lower highs and higher lows.
These formations tend to indicate ignorance before a breakout is normally in the direction of the overall direction.
Ethereum was trading at almost $3,986 at press time with a day-to-day drop of approximately 2.3%.
As the chart shows, resistance to any upside momentum in the short term is crucially at $4,080, which should be reclaimed by the bulls.
As Crypto Tony stated, “$4,080 is the level the bulls must reclaim for me to consider a scalp long. So far, the trend remains down.”
Structurally, Ethereum seems to be in an Elliott Wave corrective stage, indicating WXY.
The previous trend to reach the level of $4,700 (wave b) was then corrected by a steep fall to the level of $3,600 (wave c), and the ongoing consolidation is an indication of a sophisticated correction in that context.
The top of the wedge is close to dynamic resistance, in the range of $4,150-$4,200, whereas the bottom support trend line is floating at the range of $3,750-$3,800.
The estimated trend as plotted on the chart indicates the possibility of sideways price movement, with the ETH likely to re-test the two boundaries several times before breaking down to the $3,250 to $3,300 region in case bearish forces continue causing the price to fall.
Volume has been an underperforming factor during this consolidation, which is an indicator of diminishing purchasing interest.
The setup still favors the bears unless a firm breakout at or above $4,080 with high volume is achieved.
According to market analysts, Ethereum is weak, and this reflects the overall sentiment in the crypto industry since Bitcoin is currently being rejected by its key support group.
Any lengthy Bitcoin fix would have additional pressure on ETH, especially when the outflows of ETFs on the spot market persist.
To conclude, Ethereum is in a downside corrective formation, and short-term relief rallies would probably not be higher than $4,200.
Any sustained reclaim of the bearish wedge would invalidate but otherwise, would allow the bearish wedge to proceed to greater levels of retracement in the futures sessions.


